How to Set Up Google Analytics 4 for your Ecommerce Business: A Comprehensive Guide
Posted on 10/31/2023
Reviewed by Arnt Eriksen updated at 11/24/2023
Introduction
What separates an efficient business from an inefficient one?
And to know what you need to optimize, you need data. Accurate, actionable data.
I will help you get it.
I will tell you everything you need to know about setting up Google Analytics 4 (GA4) for your eCommerce business.
This can double as an audit of your GA4 or a guidebook showing how to fix the most commonly encountered issues related to GA4.
I will assume that you already know how to create a GA4 account. I will jump straight to discussing the settings that are necessary to obtain precise data.
This guide will:
- Help you make sure that all the important aspects of GA4 are implemented correctly.
- Provide information about the most useful e-commerce reports and help you create a Google Data Studio report based on this data.
Part 1: Tracking overview
1.1. General settings
1.1.1. General tracking configuration
To get started with GA4, you will first need to make sure it is actually tracking your website. Everything I will tell you about later in this guide depends on this being true.
There are several ways you can implement this:
- Inserting a Google Analytics Google tag (gtag) directly into your website’s code.
- Through Google Tag Manager (GTM).
- Or just by using a special plugin or extension if your website is built using a content management system (CMS).
Assuming that your website is not built using a CMS, we’ll describe how to ensure GA4 is tracking your site using the first two methods mentioned above.
First, you will need to find the Google tag that will be unique to your account. To do that, you will need to:
- In your Google Analytics account, go to Admin, then Data streams.
- Select the data stream you need.
- Click Configure tag settings, then Installation instructions.
- Select the Install manually tab. You should see something like this:
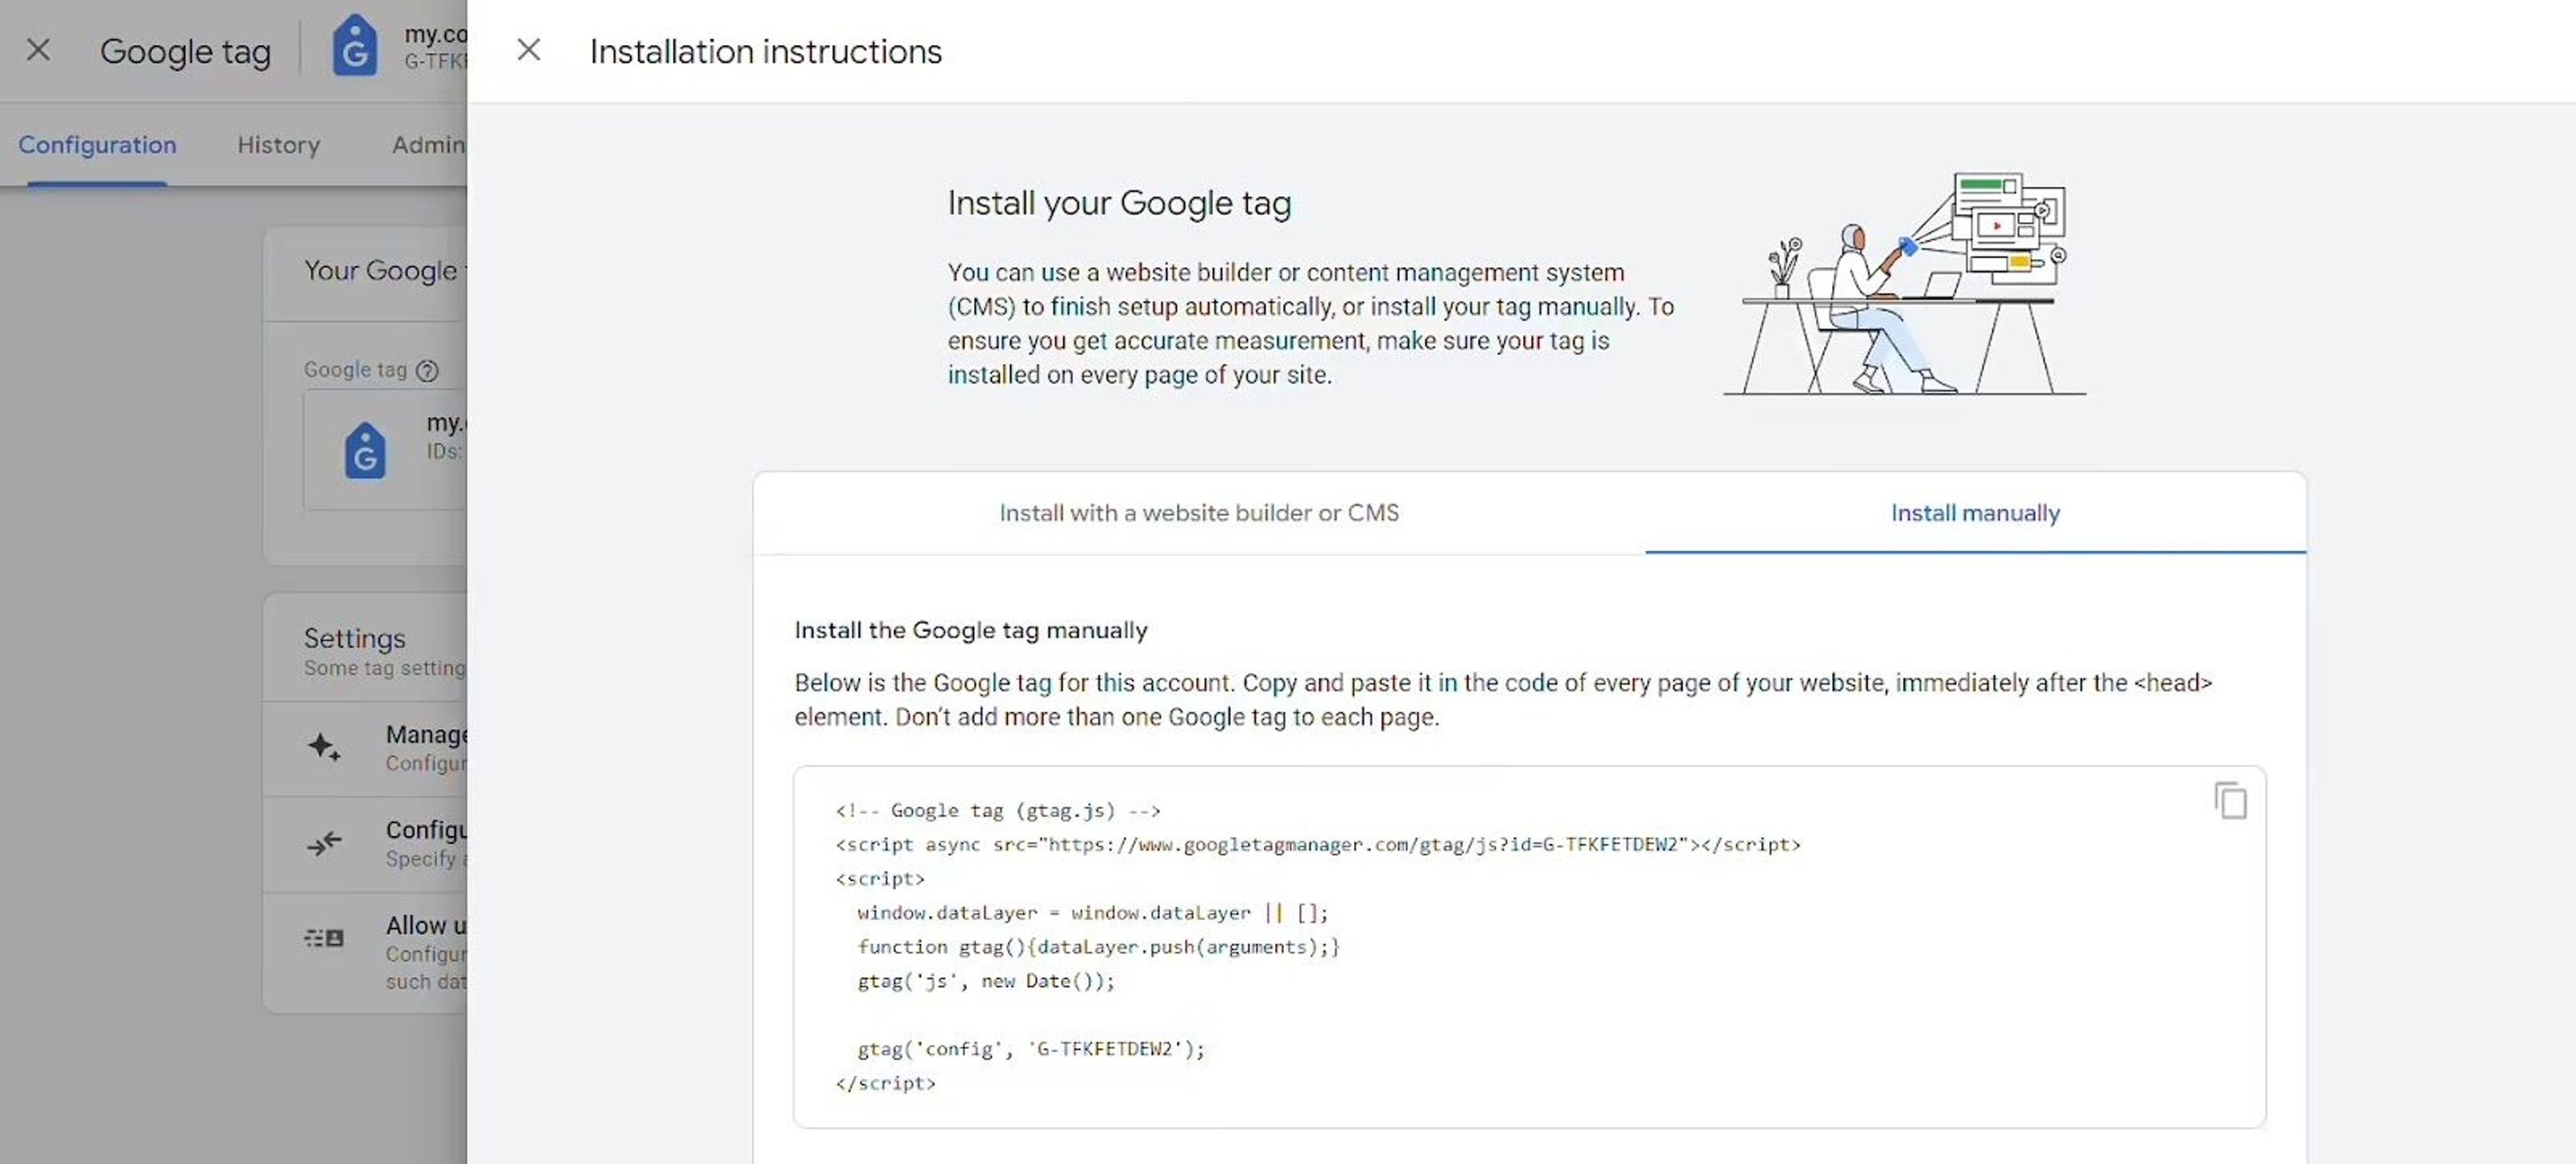
This is the gtag code you will need to use.
Next, you have to paste this text into your website’s code.
To ensure that your tracking is accurate, you will need to include this code on all of the pages of your website. You may well want to automate this process. Consult your developer to find the best way to insert the code on your website such that it will be displayed on all of its pages.
You will need to copy the gtag code mentioned above into the web page’s code. It is best that the gtag code is added directly into the header after the opening <head> element, like this: <head> gtag code </head>.
And that’s it! If everything went well, Google Analytics should now be able to track your website.
If that doesn’t work for you, or if you’d prefer to avoid modifying code, here is how to implement tracking using the Google Tag manager:
1. First, you will need to create a new tag. Choose an informative name that will avoid any confusion for other people working on your account.
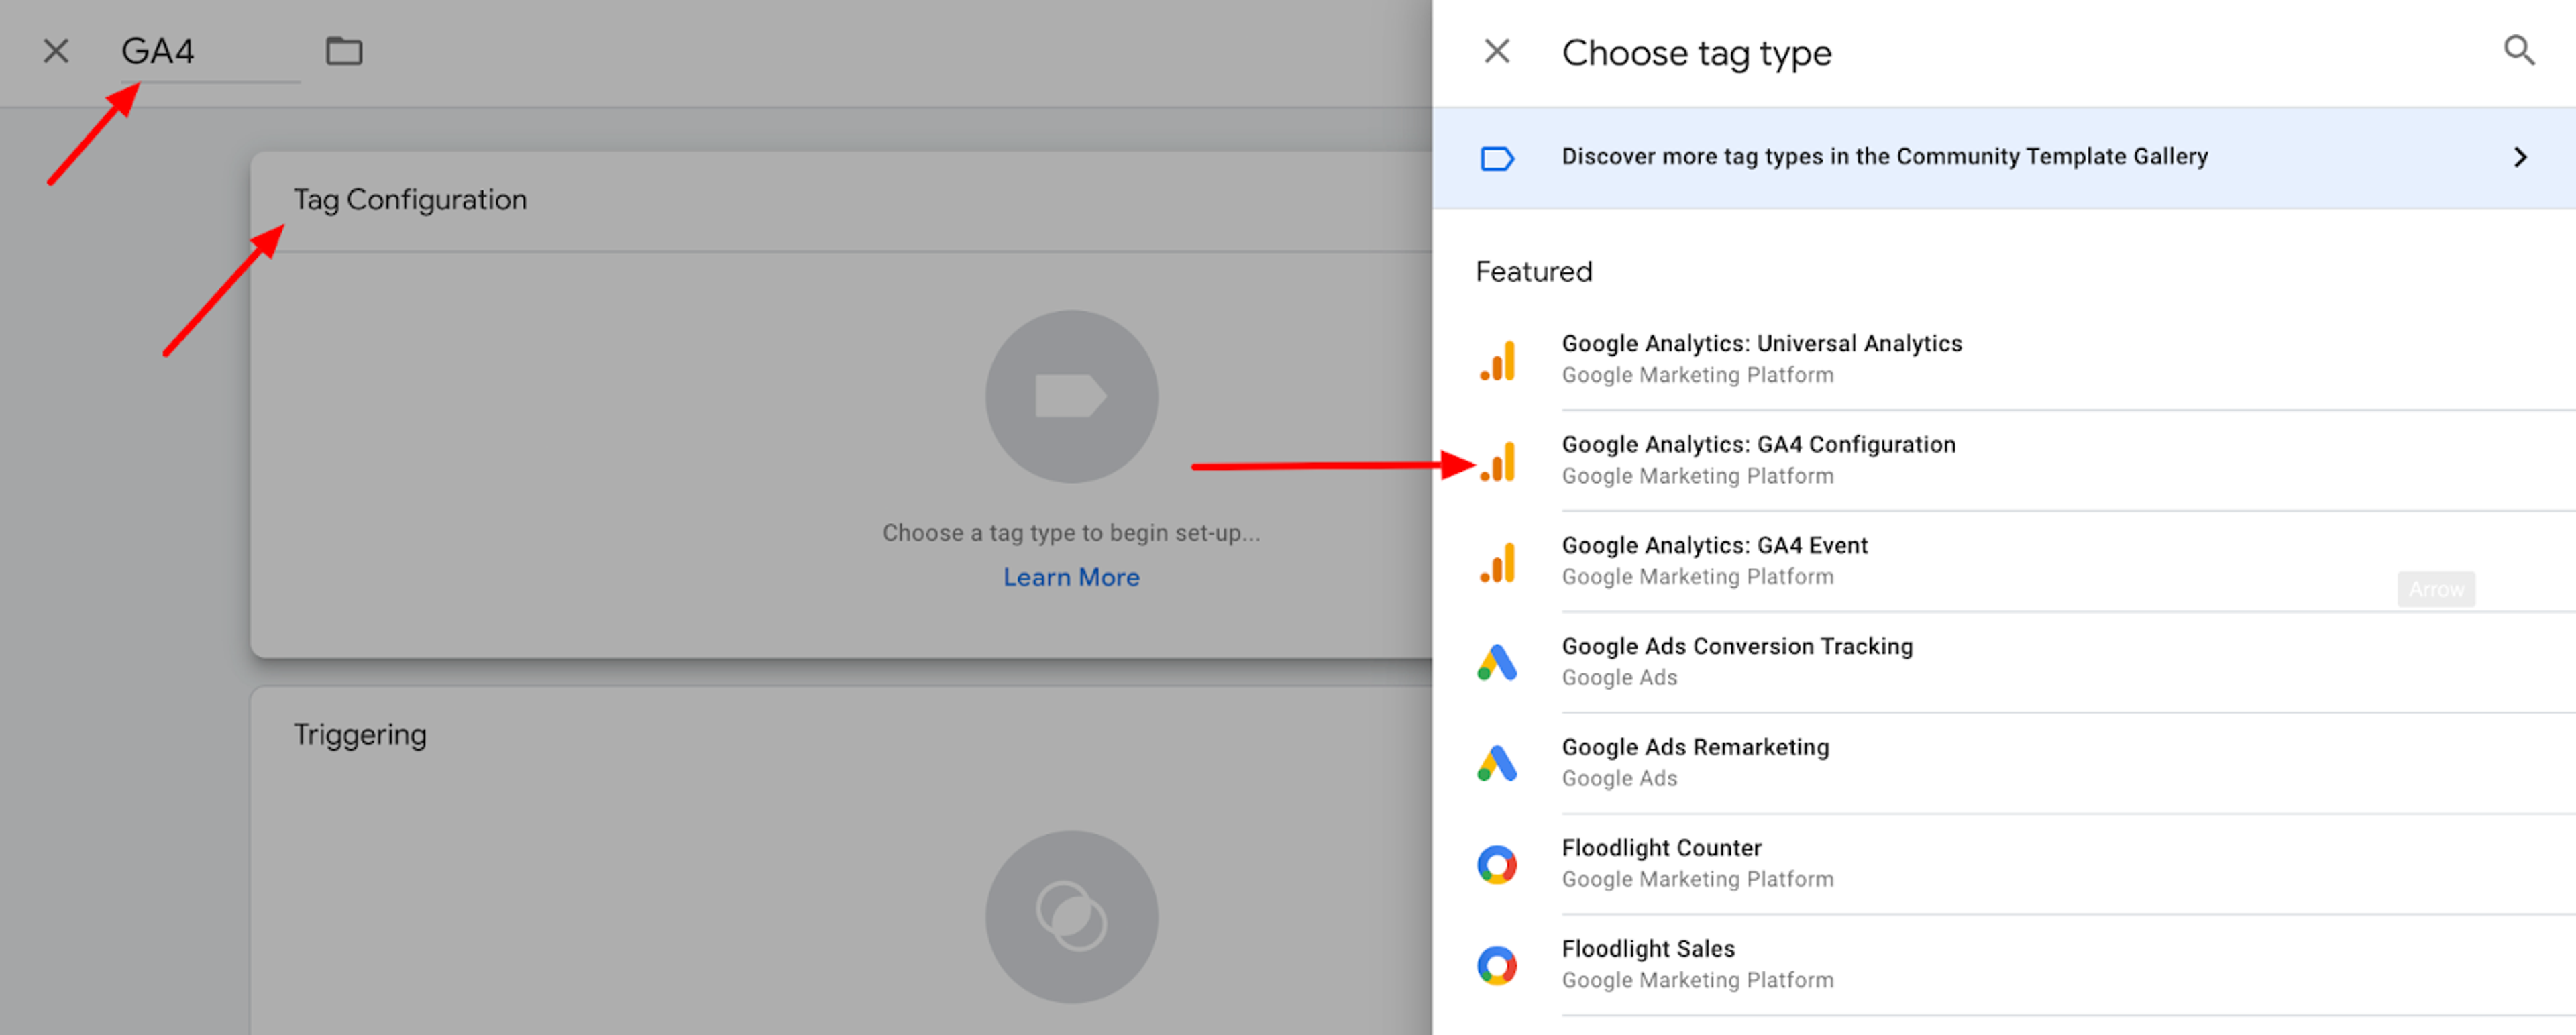
2. Then, click on Google Analytics GA4 Configuration under the heading Tag configuration.
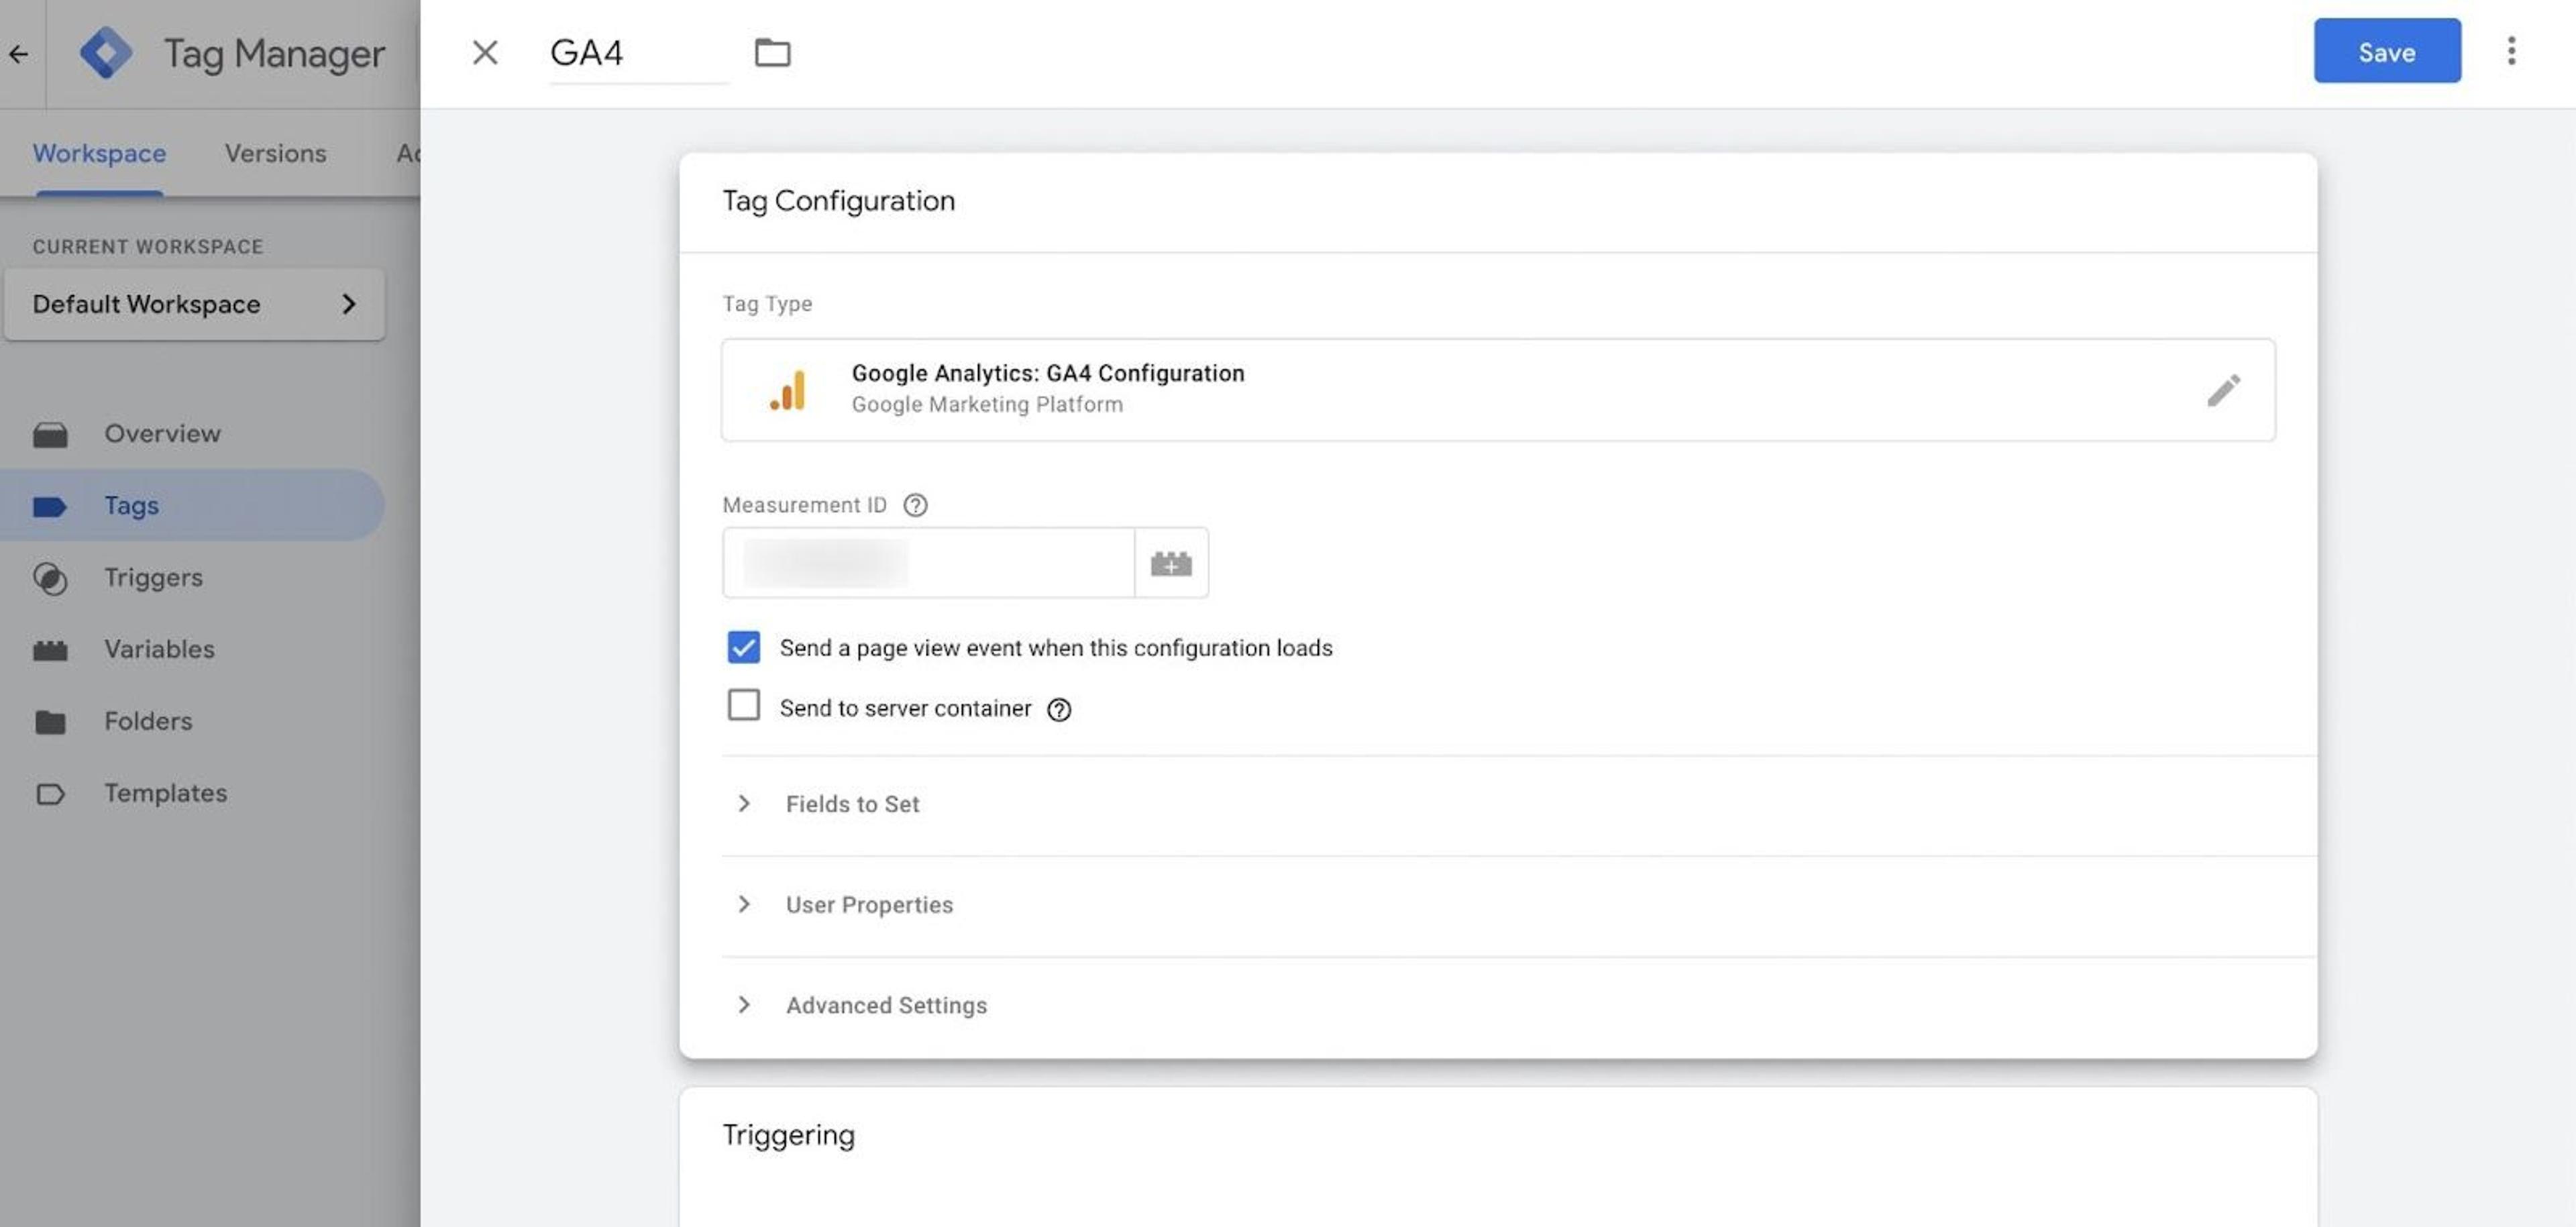
Here, enter your data stream Measurement ID that you can find in the Data stream settings of GA4.
3. Set up a trigger. A trigger describes the conditions when a tag should be executed. In this case, it is best that you click on All Pages under Triggering.
4. Click Save.
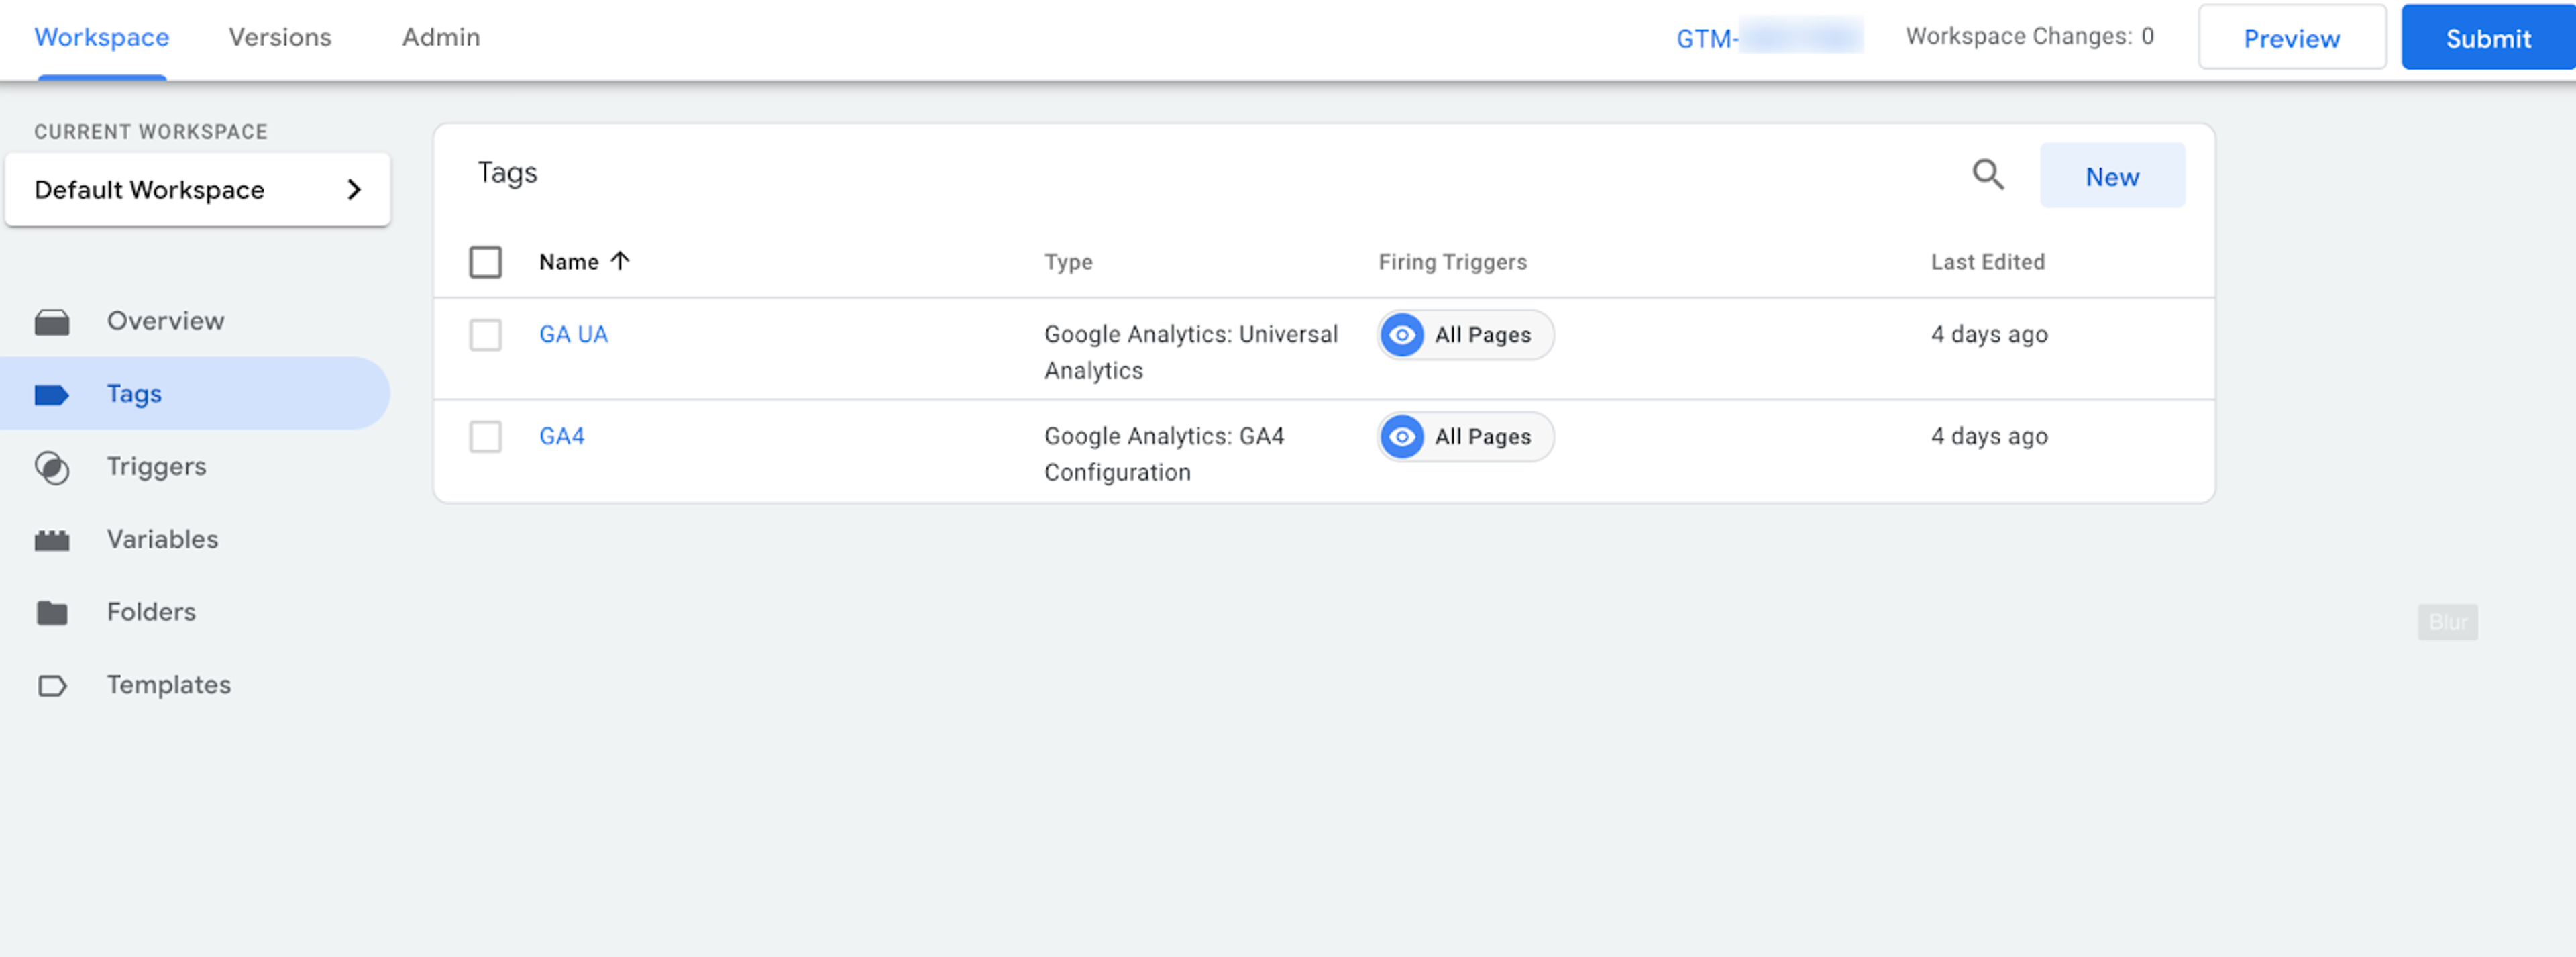
5. At this point, the tracking is ready, but not yet applied to your website. To finish, click the blue Submit button in the right upper corner of your screen.
6. You will see something like this:
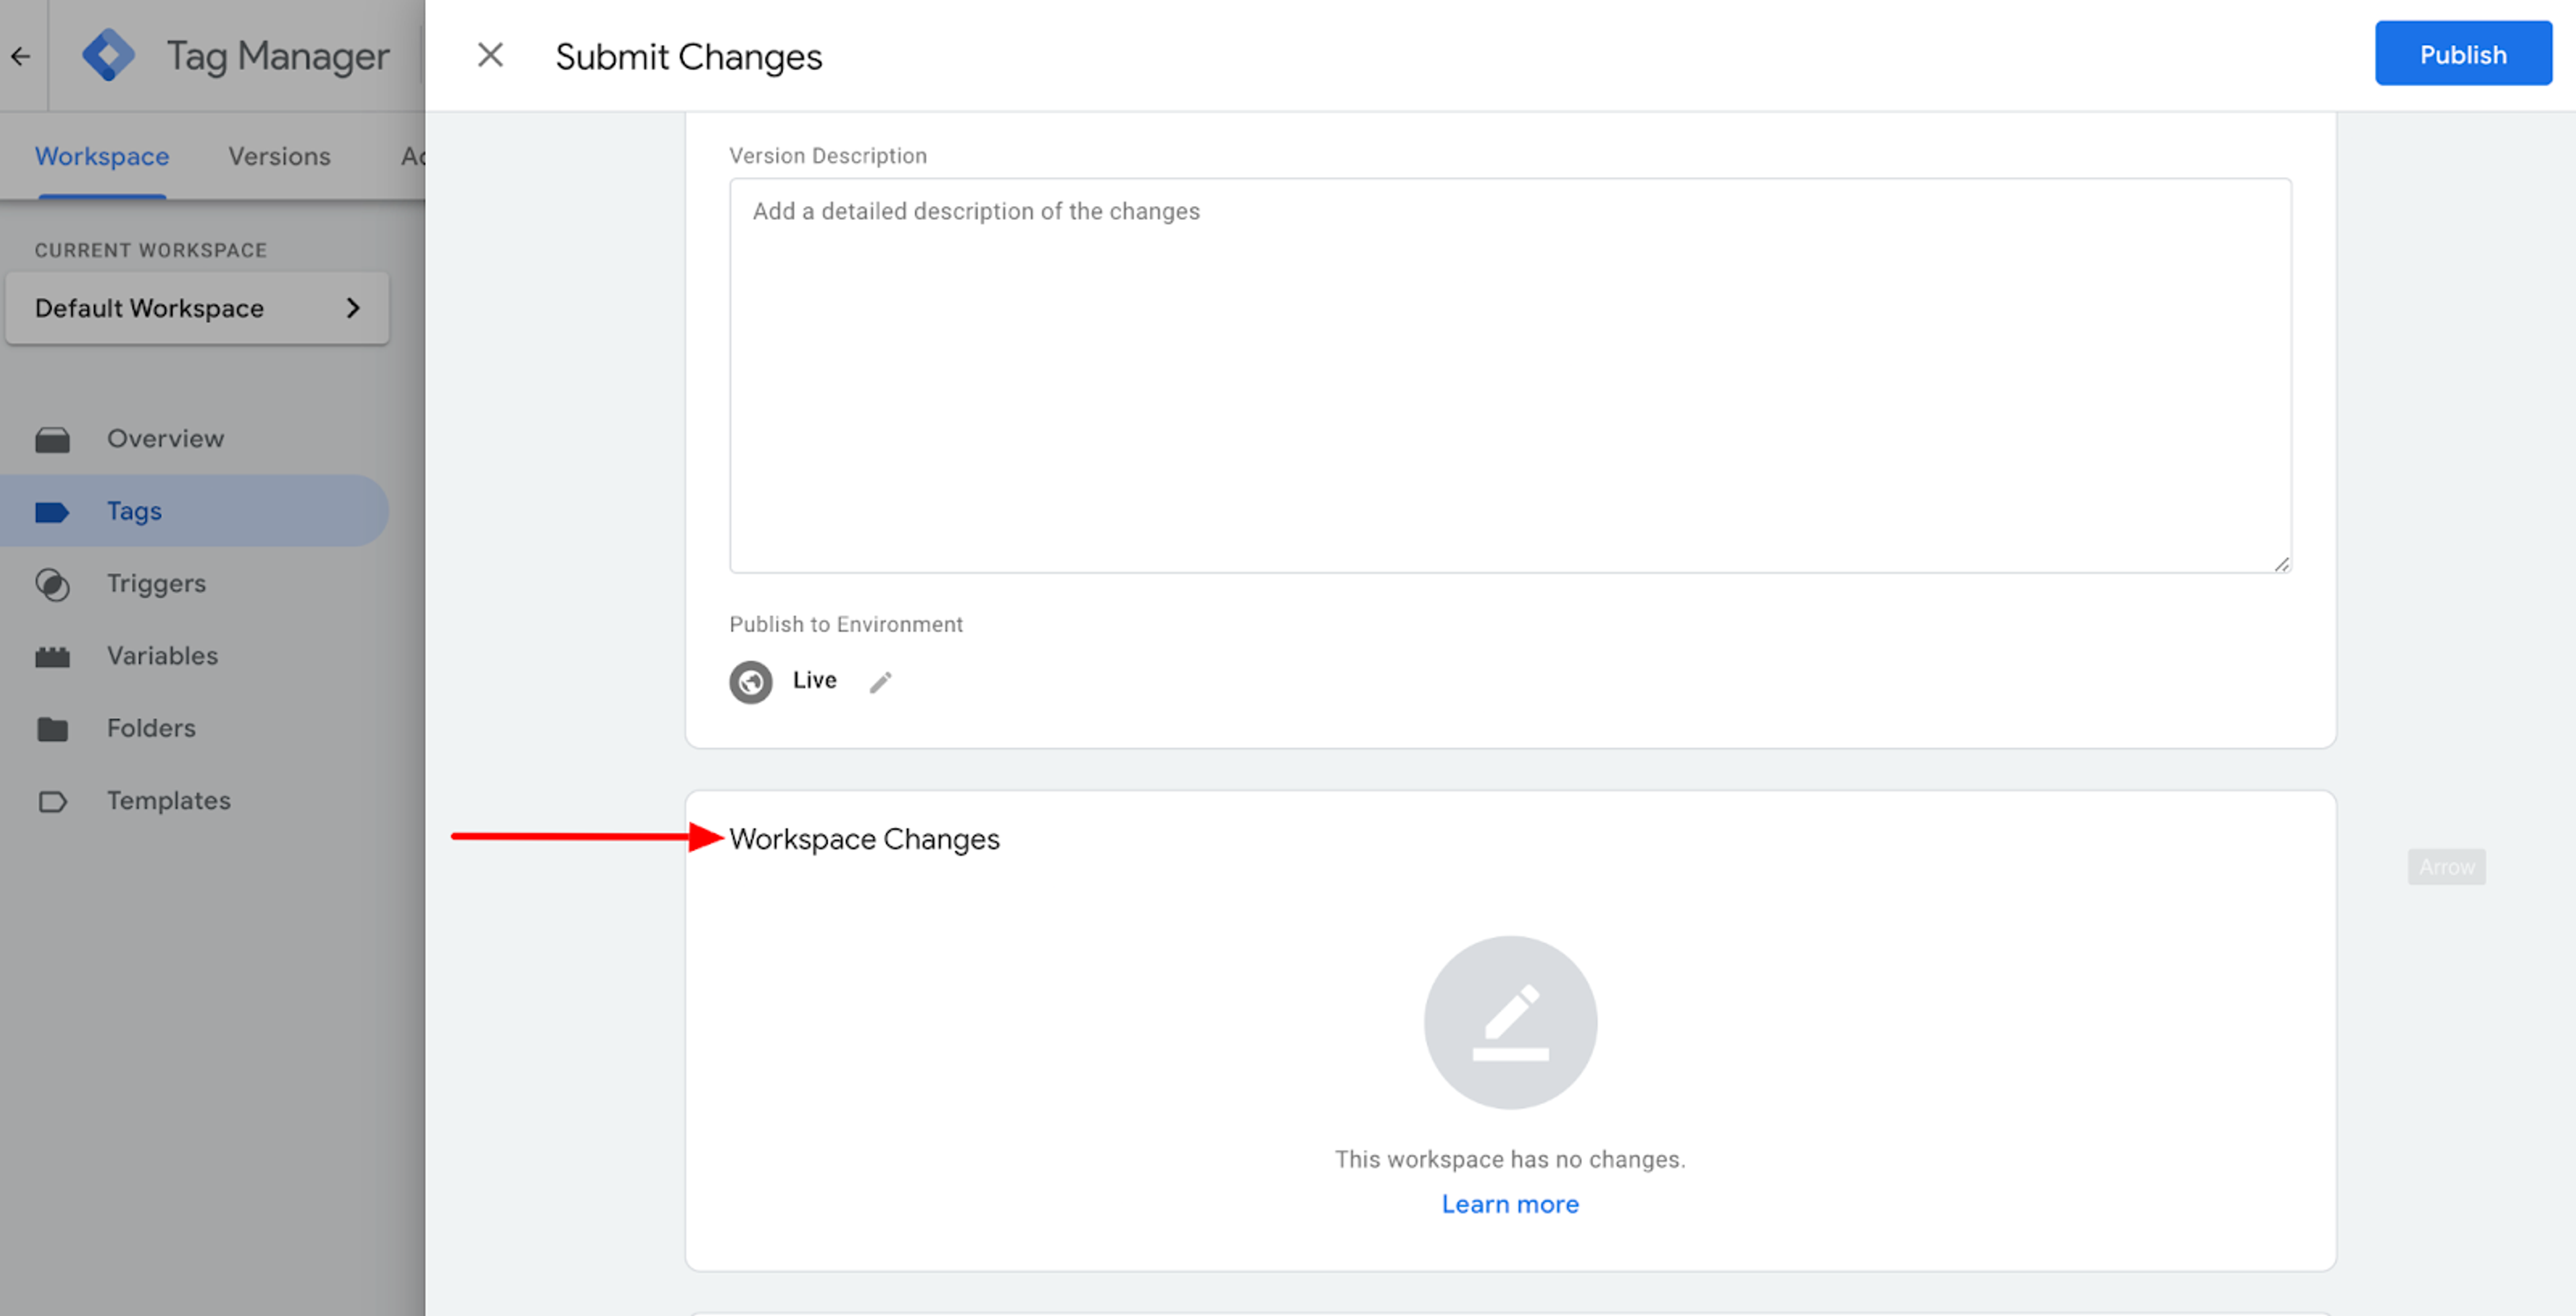
The Workspace Changes section should contain the tags you have just added.
7. Click Publish.
GA4 tagging will now be implemented on your website with the help of Google Tag Manager.
Now, you will need to test and debug your website to ensure that the tracking you’ve just implemented works in the manner it should.
1.1.2. Review property settings
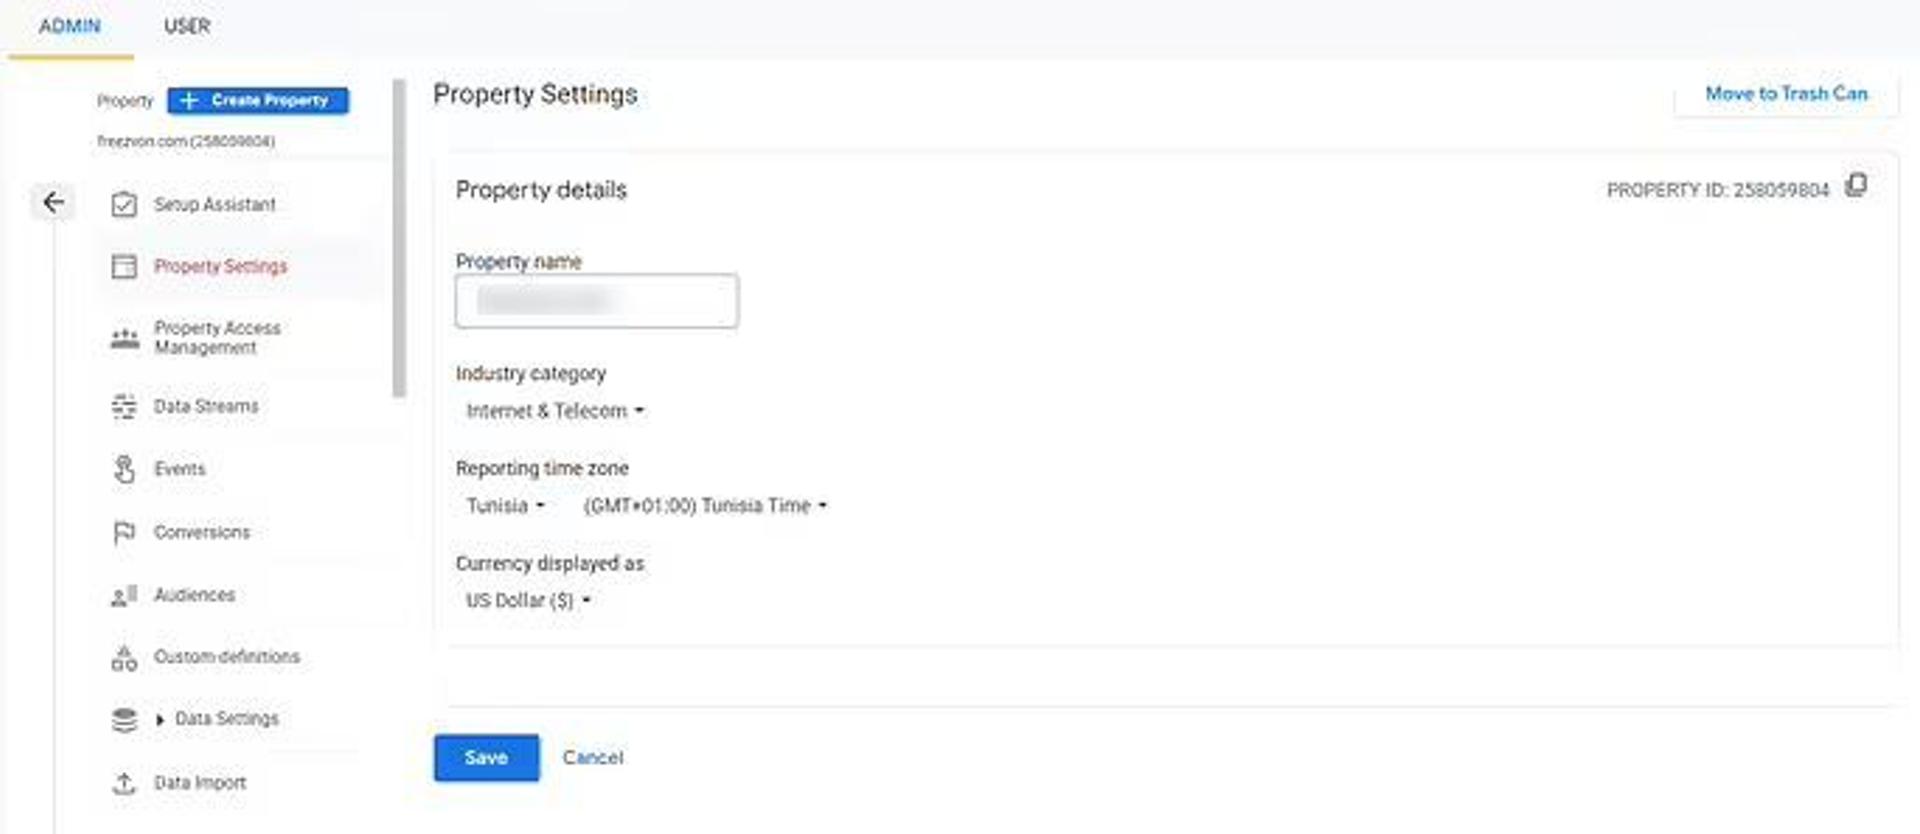
To avoid confusion in the future, it is important to make your property settings as easy to understand as possible.
Although you can name it anything you want, it is advisable to set the property name to match your business or website. This way, your GA4 account will be easier to navigate and organize.
Selecting the industry category setting that best matches your business. This will allow you to benchmark your performance against other companies in the same field. If that is something that may be useful to you, I recommend you pay attention to this setting.
The time zone and currency settings are very important. Having the right time zone will make it easier to determine when your traffic is highest and optimize for times of high demand. Currency, on the other hand, is important to make your financial reports accurate.
1.1.3. Retention rate
The next thing we should take a look at is the retention rate.
This statistic allows you to see how many customers of your online store were satisfied enough to return for more; this is, of course, a rather important indicator of how well your business is doing.
Standard reports in Reports Workplace, like Traffic acquisition, Pages and screens, or ecommerce purchases, are not affected by the data retention setting offered in GA4. These reports are based on pre-calculated tables that cost very little to store and process.
The aggregated tables you may already have will not be lost by making changes here. Your daily users, sessions, and events are safe, and you will be able to access these reports for time periods right back to the creation date of your website.
This data retention setting has an effect on Exploration reports, or to be more precise, the time period that controls data retrieval for the report (the custom report building feature in GA4).
Exploration reports are a great way to gain more information about your users and their interaction with your website. Having Exploration reports at hand has many benefits:
- You can quickly perform ad hoc queries (you can “question” your database using Structured Query Language (commonly referred to as SQL) or another query language).
- You have more control over your data via the use of segments, sorting, and refactoring.
- You can create segments and audiences.
- You have the option to easily share your discoveries with other users of the same Google Analytics property.
- You can export your exploration data so that you can use it in other tools.
By default, all user-level and event-level data will be automatically removed from the Google Analytics servers after 2 months of user inactivity; this removal will take the associated Exploration reports data with it.
This is suboptimal for businesses dealing in products that are not likely to be bought on a regular basis.
For example, if you are dealing in car tires on a B2C model, it is highly unlikely that a client will be returning after just two months. In this case, GA4’s default settings will not accurately capture your customer retention rate.
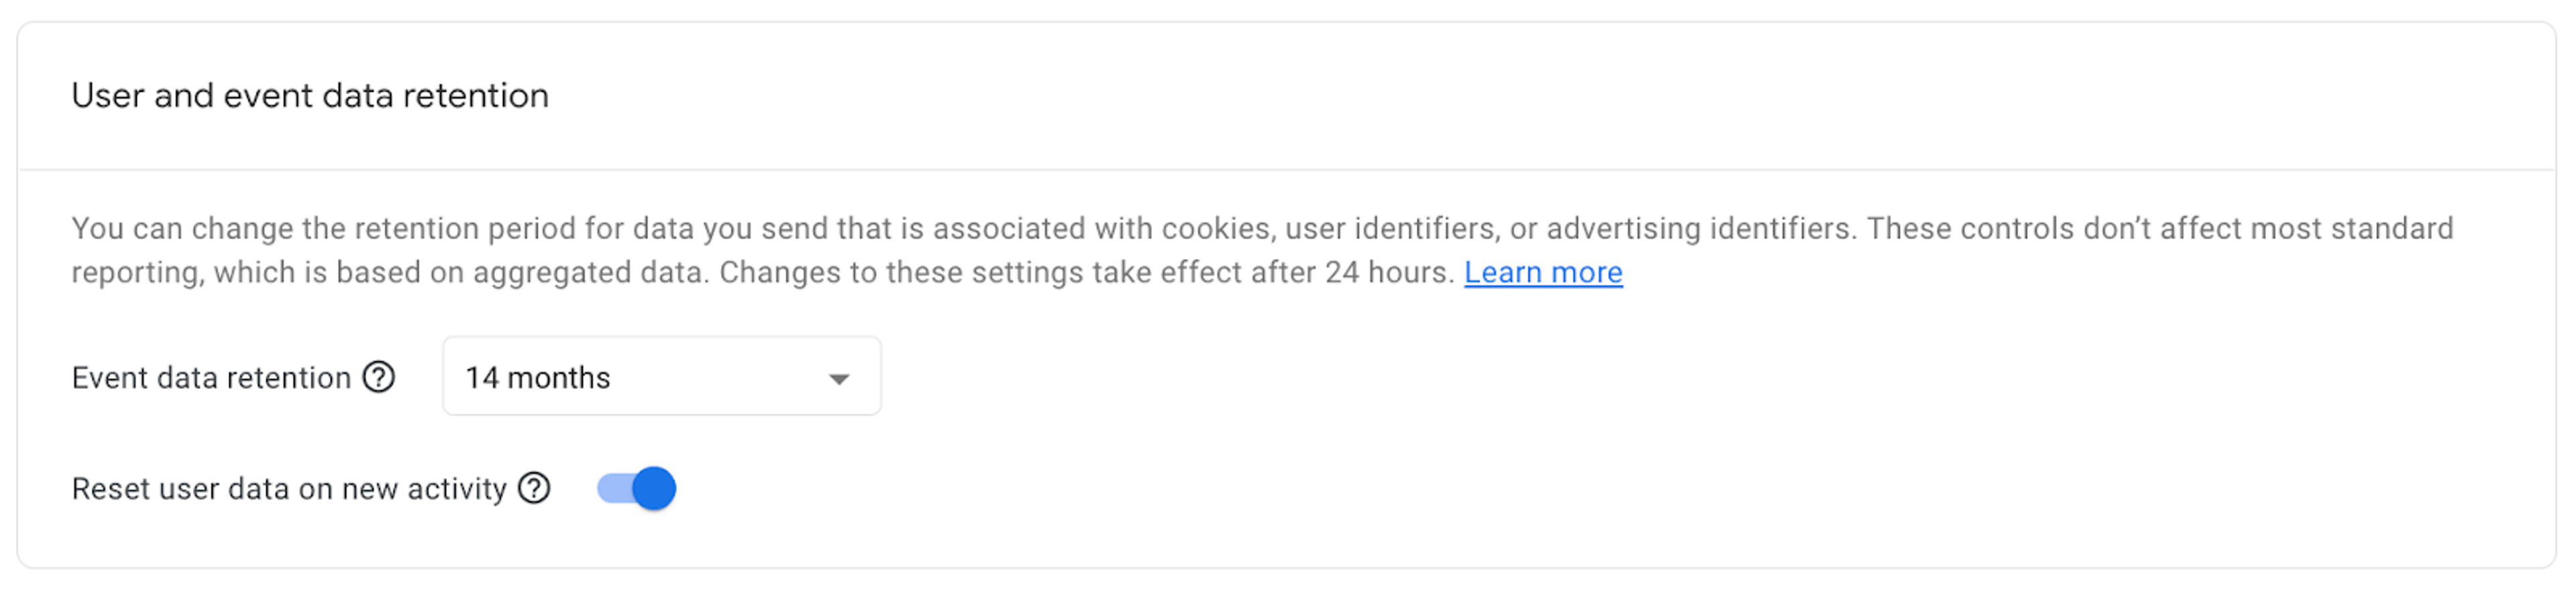
To combat this, I recommend setting the event data retention to at least 14 months.
1.1.4. User ID
By default, when a single person accesses your online store from their smartphone, tablet, laptop, and, finally, desktop, GA4 will count them as four separate individuals.
To prevent that and start receiving accurate data, you need to choose the Blended model in the reporting identity option of your GA4 property settings.
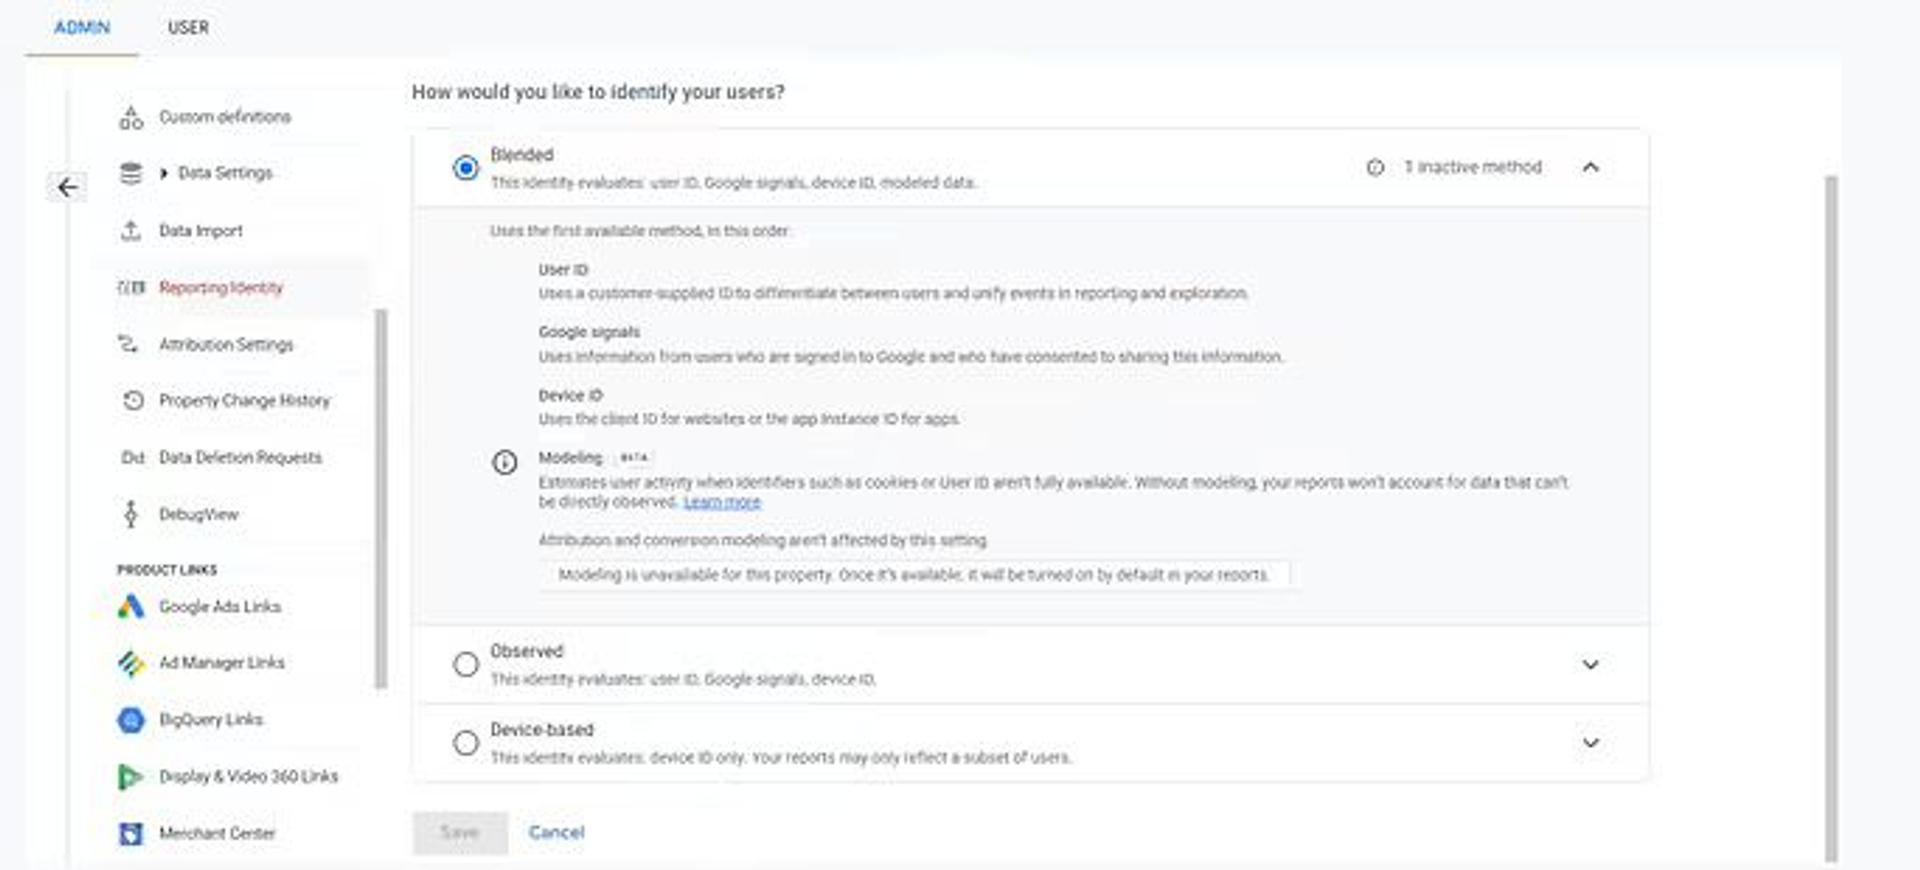
This way, every user will be tracked individually, no matter what device they use to access your store.
1.1.5. Google Signals
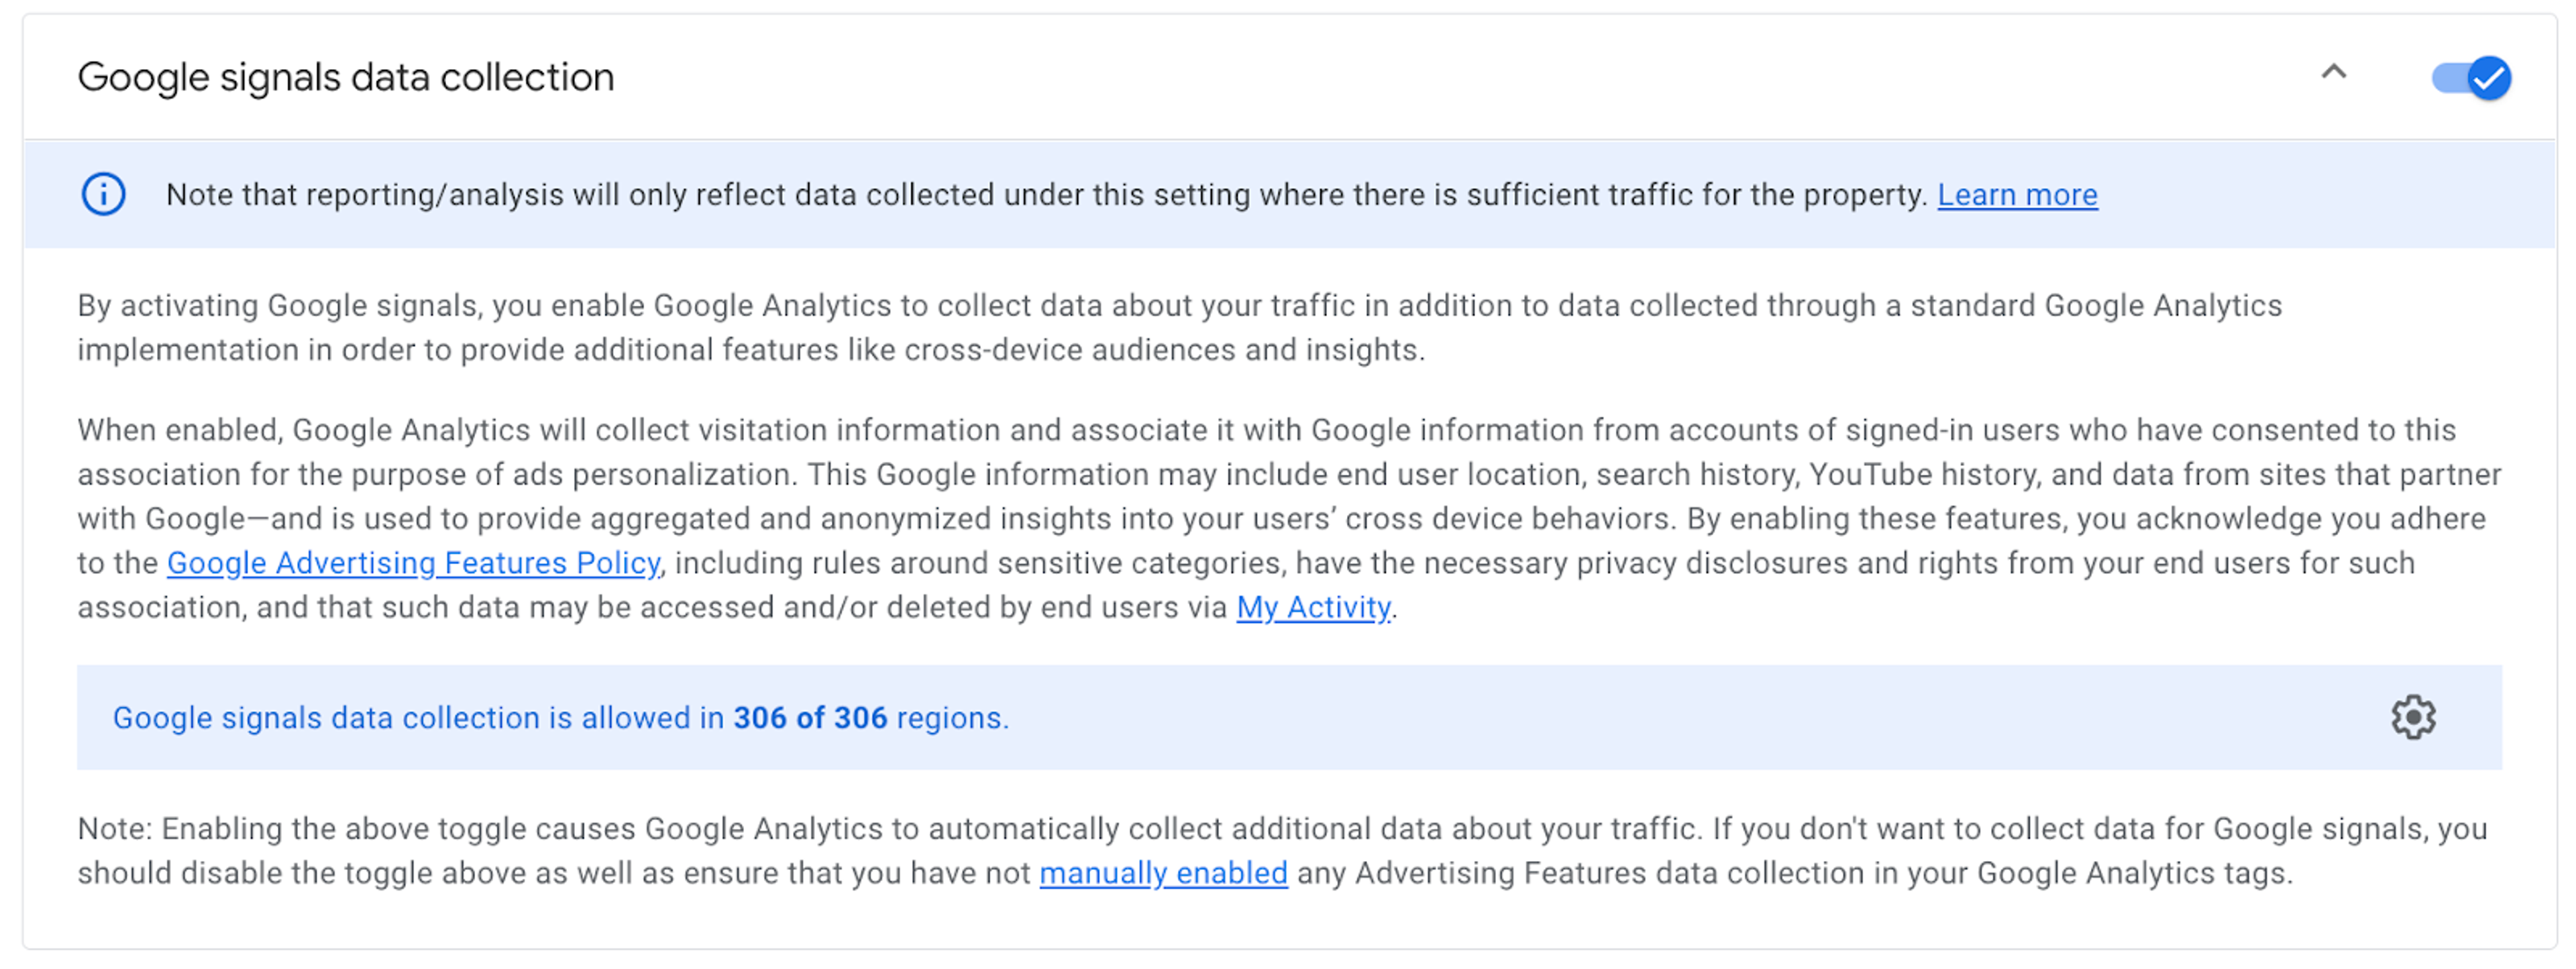
This will allow you to take your user tracking even further. Google Signals allow you to monitor traffic coming from the different devices of a given user. This makes it easier to analyze the actions of a given person on your website.
Keep in mind that this only works with users that are signed into their Google accounts and have consented to their data being collected. Therefore, your data will not be as accurate if you are in a business sector where products or services are often searched for in incognito mode.
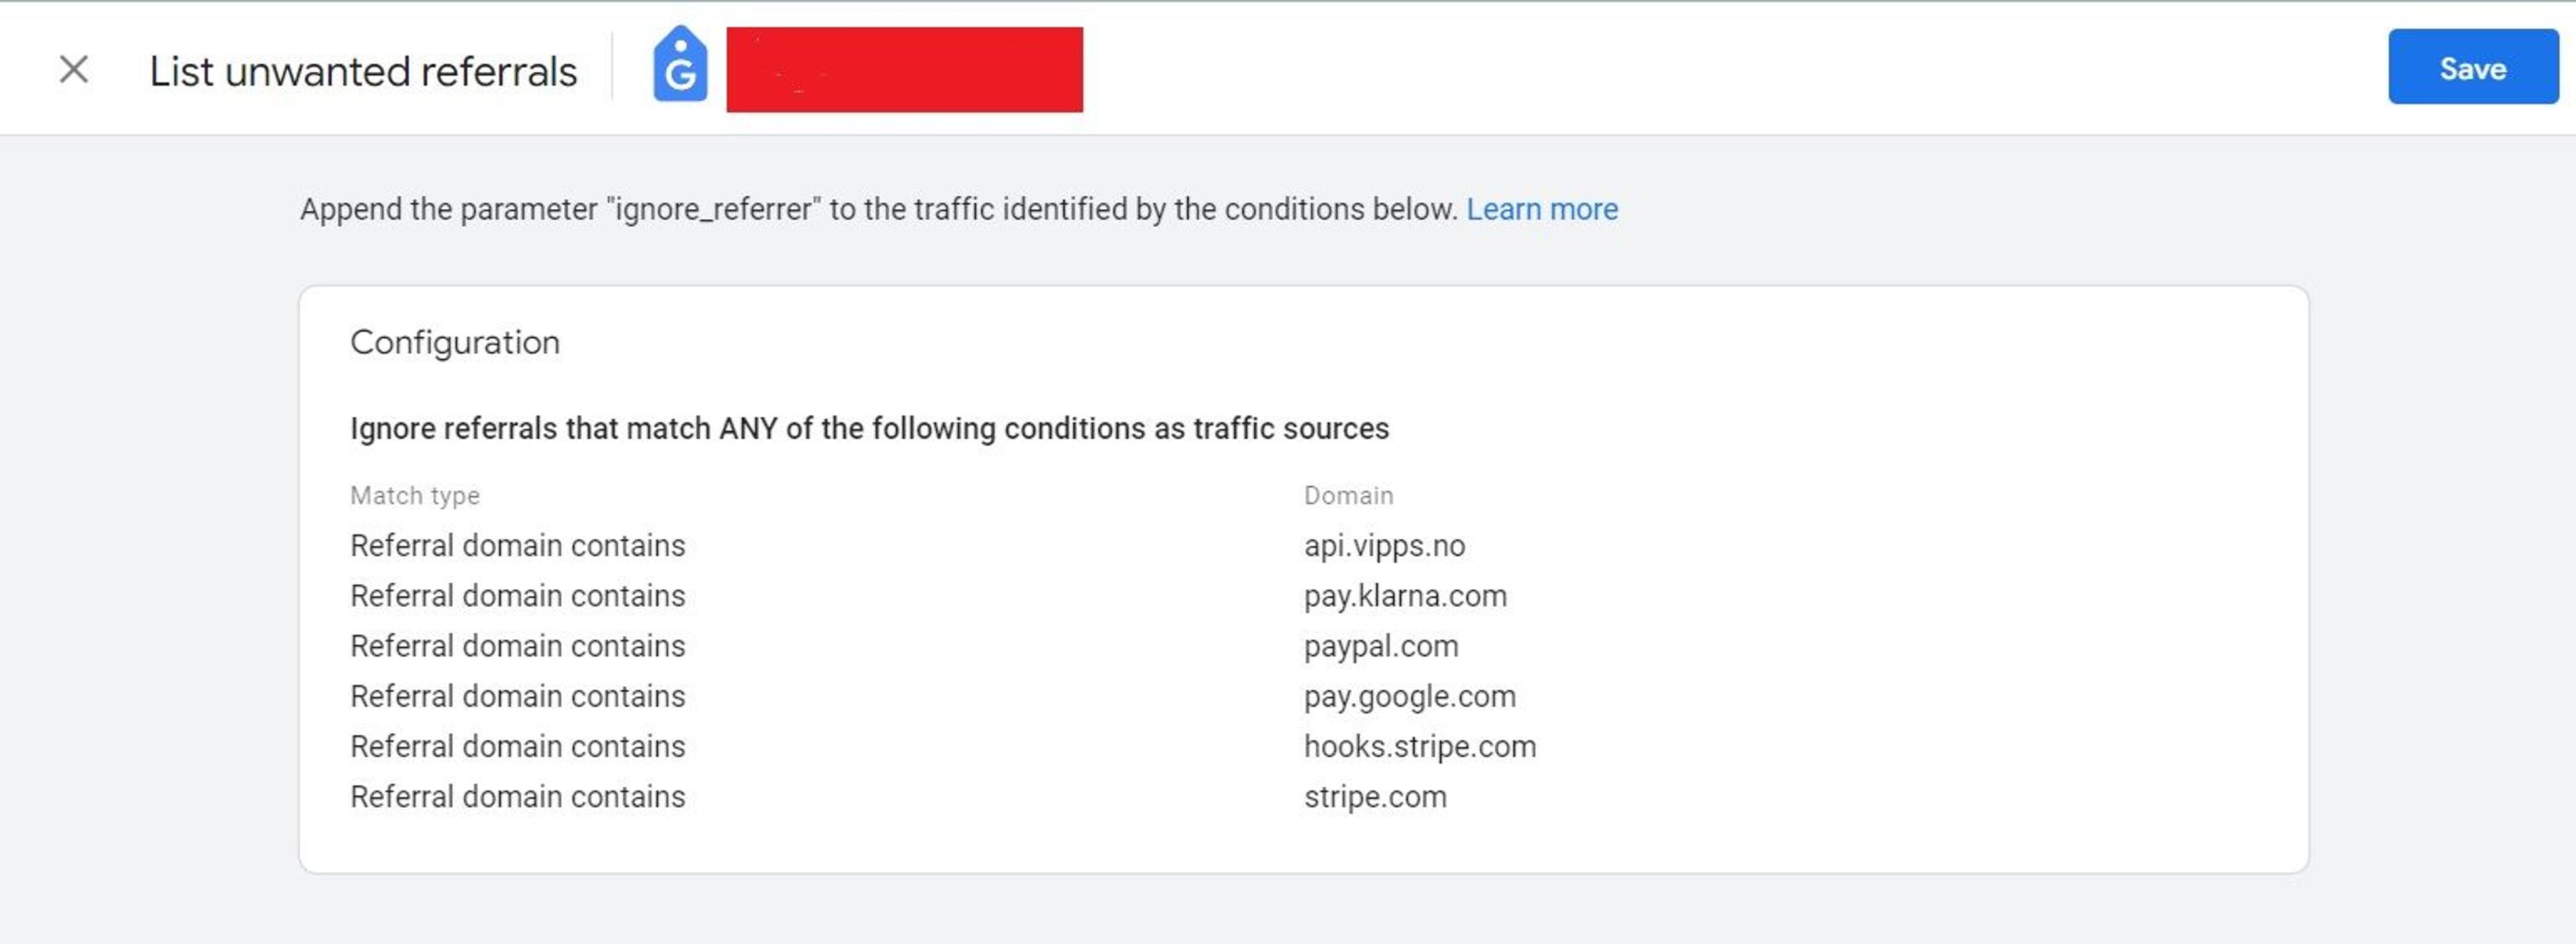
1.1.6. Adding Unwanted Referrals
In GA4, referrals are the segment of traffic that comes from a different domain, like a link on a third-party website or from payment gateways (Paypal, Stripe, etc.). When a user comes to your site via a backlink in one of your guest posts, their traffic is assigned under the referrals segment.
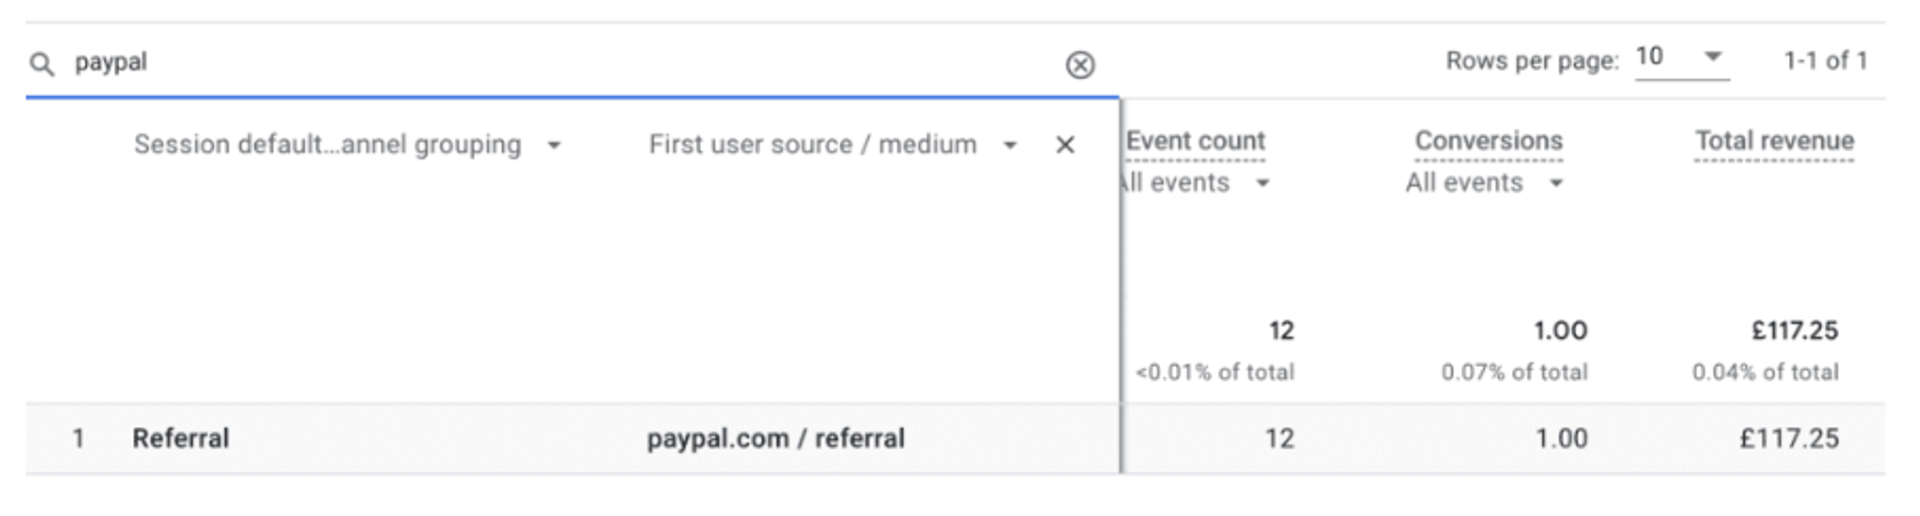
I recommend excluding all these unwanted referral domains to make your data clearer. You can find this setting under Admin - Data Streams - Choose corresponding data stream.
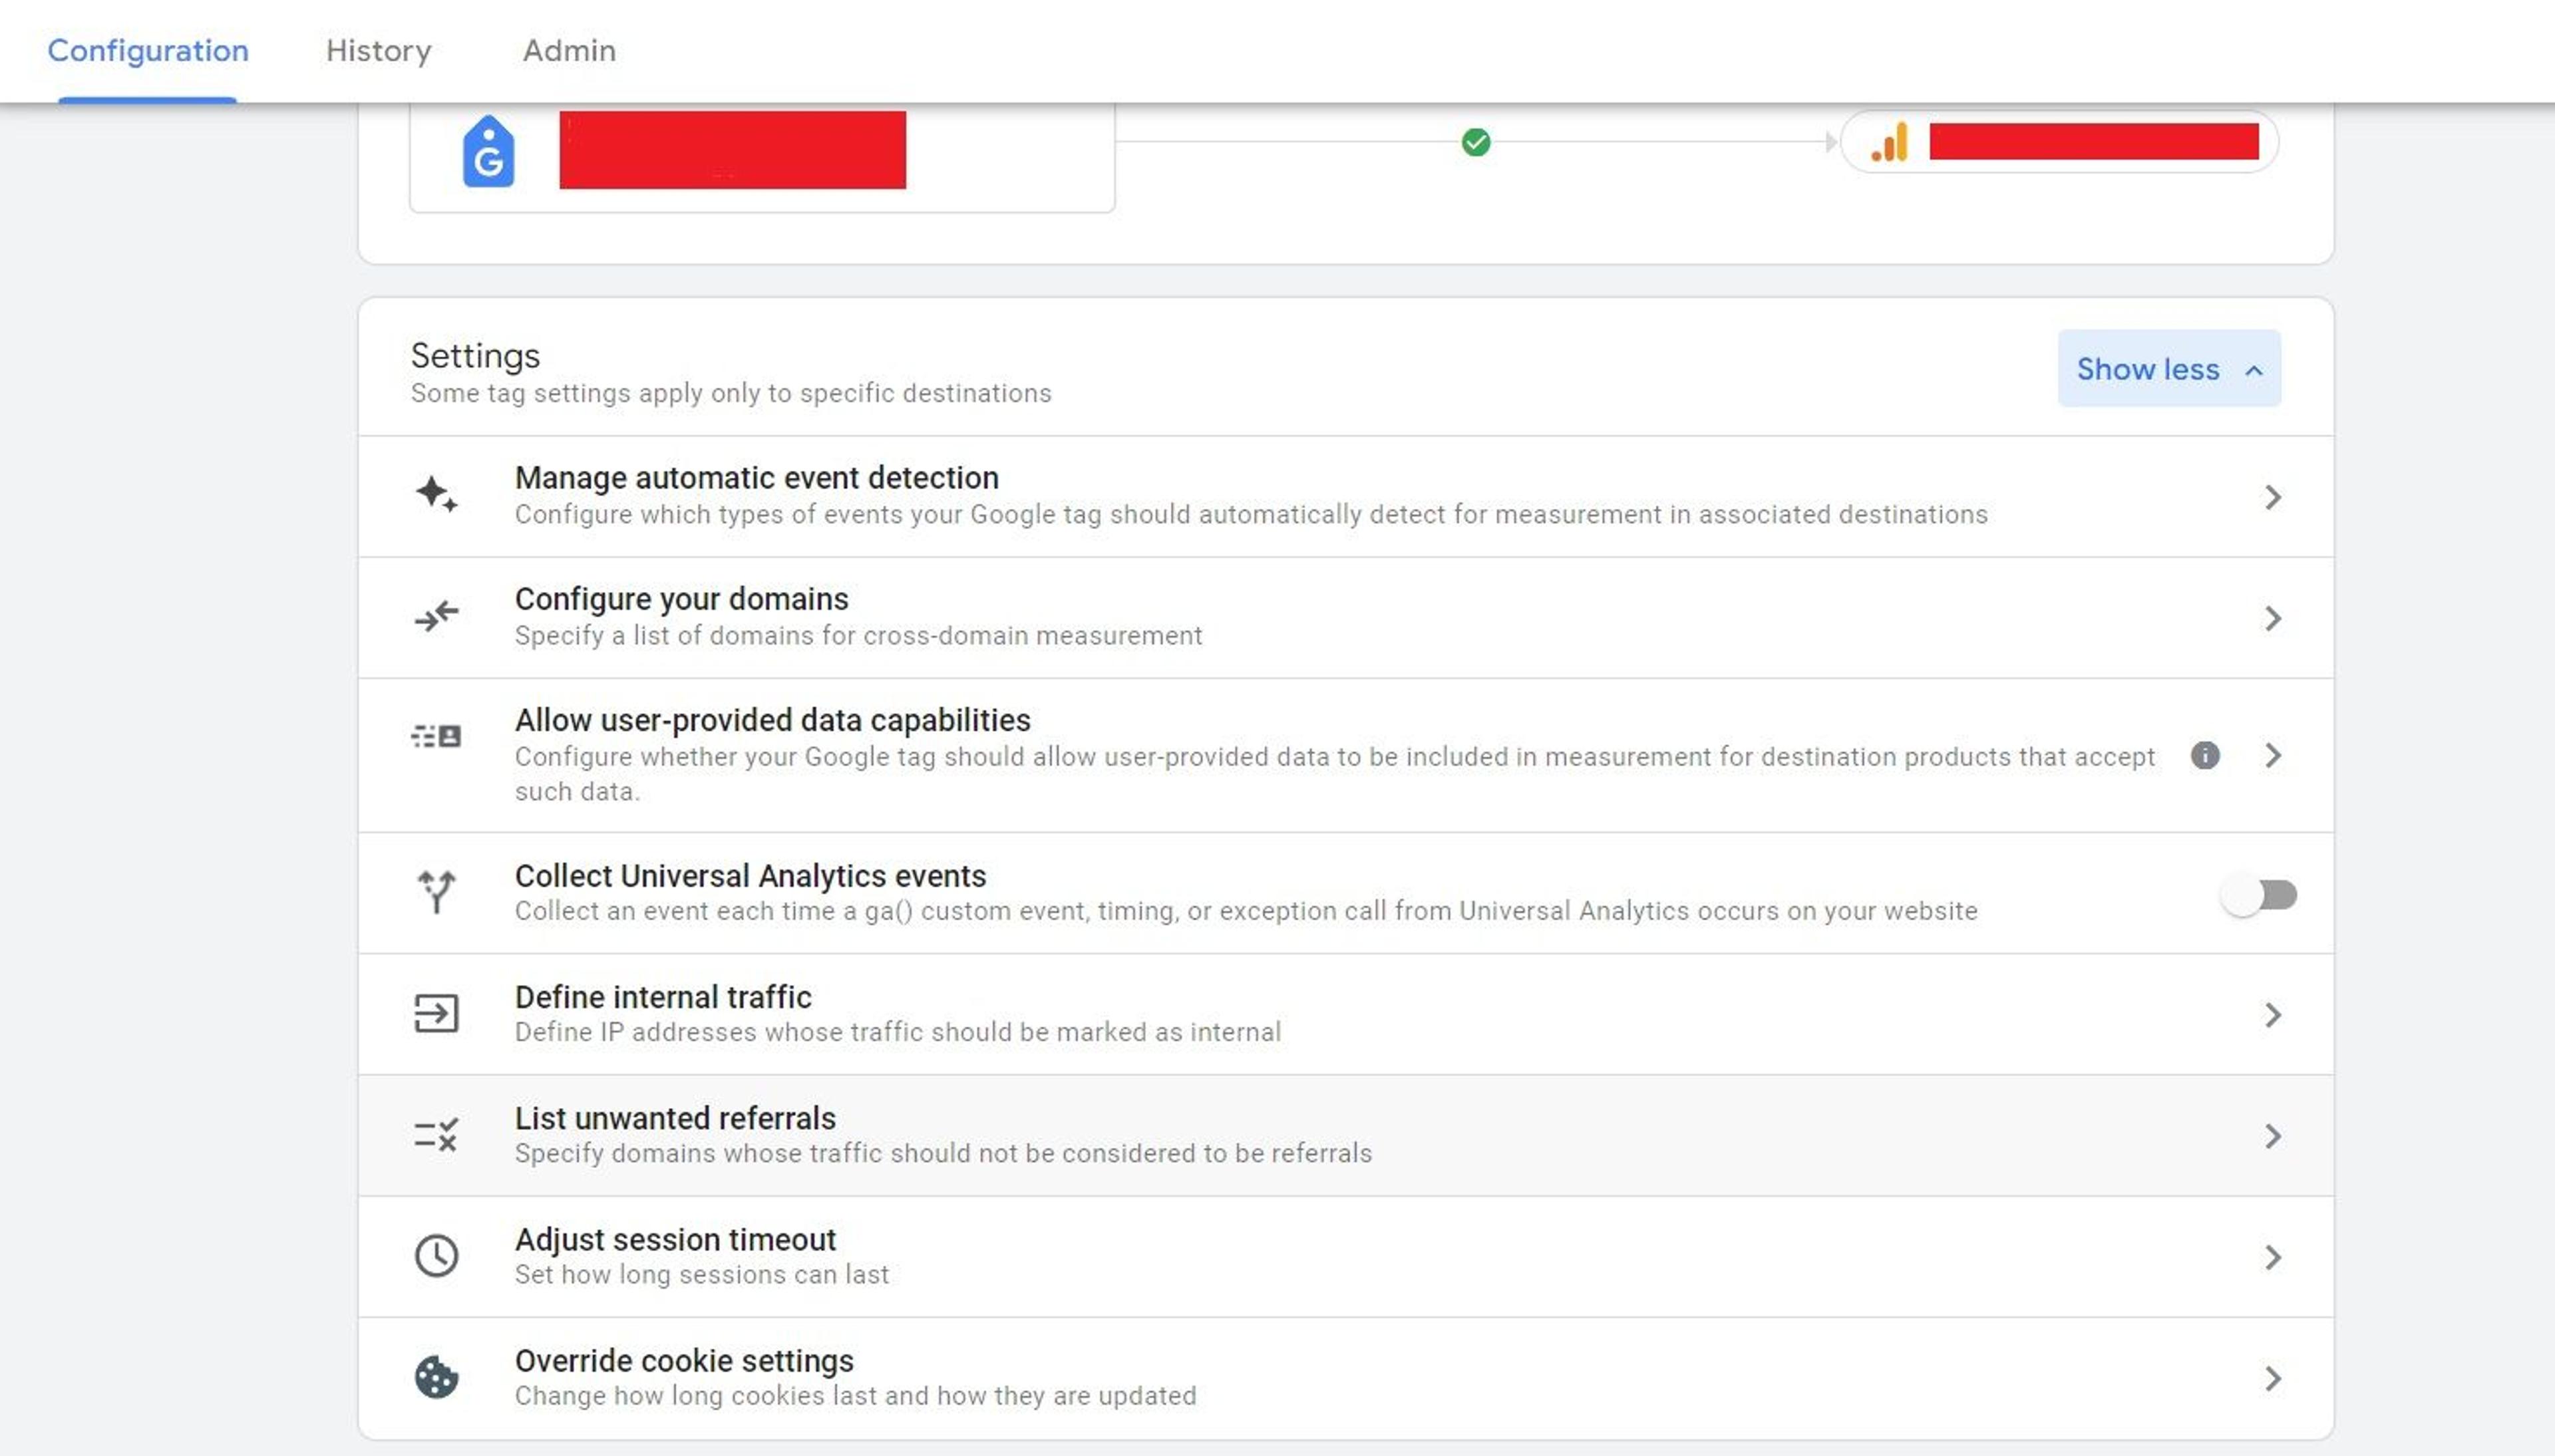
Here, you will have to open the ‘List unwanted referrals’ section and add the relevant domains.
Cost-per-click (CPC) traffic can sometimes fall into this segment as well. This is a problem that can interfere with our statistics and, subsequently, analytics.
To combat this, in the case of Facebook, you’ll have to make sure all your active ads have the correct Urchin tracking module (UTM) tags so that they are assigned under the segment Facebook/CPC.
1.1.7. Add developers and internal traffic filters
There are a variety of reasons that members of your team may be surfing around your website.
Your copywriters may be looking for inspiration or suitable links to paste into their text. Designers may want to take a look at how their work looks on different devices. Developers may have to test new features that they’ve implemented. And the sales and marketing team members could be doing anything from checking on product reviews to thinking of ways to further optimize your website for conversions.
All that traffic will interfere with your statistics. There is good news, however. You can add your team members’ IP addresses to the exclusions list to prevent GA4 from tracking them. To do that, you will need two things: a rule to identify internal traffic and a filter at the property level to exclude it.
Let’s start with the rule.
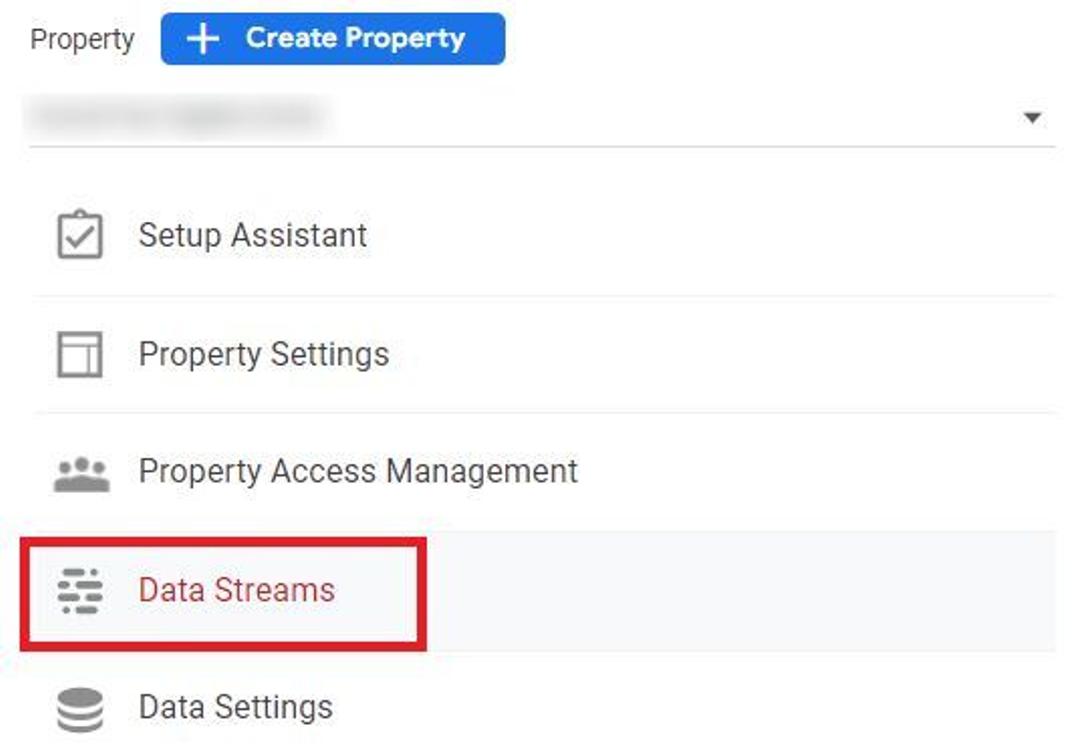
1. Go to Admin and click Data streams under the Property column.
2. Click Web, then select a web data stream.
3. Click Show all, then Define internal traffic, and then Create.
4. Choose a name for your rule. Try to keep the name descriptive and easily understood to avoid any confusion that could otherwise arise in the future.
5. Define a value for the event parameter traffic_type. The default value is internal, but you can choose whatever you want to best represent the location from which this traffic is coming from (e.g., uawc_kyiv, uawc_oslo, and so on). This may be particularly useful if your company has several offices in different locations with different IP addresses.
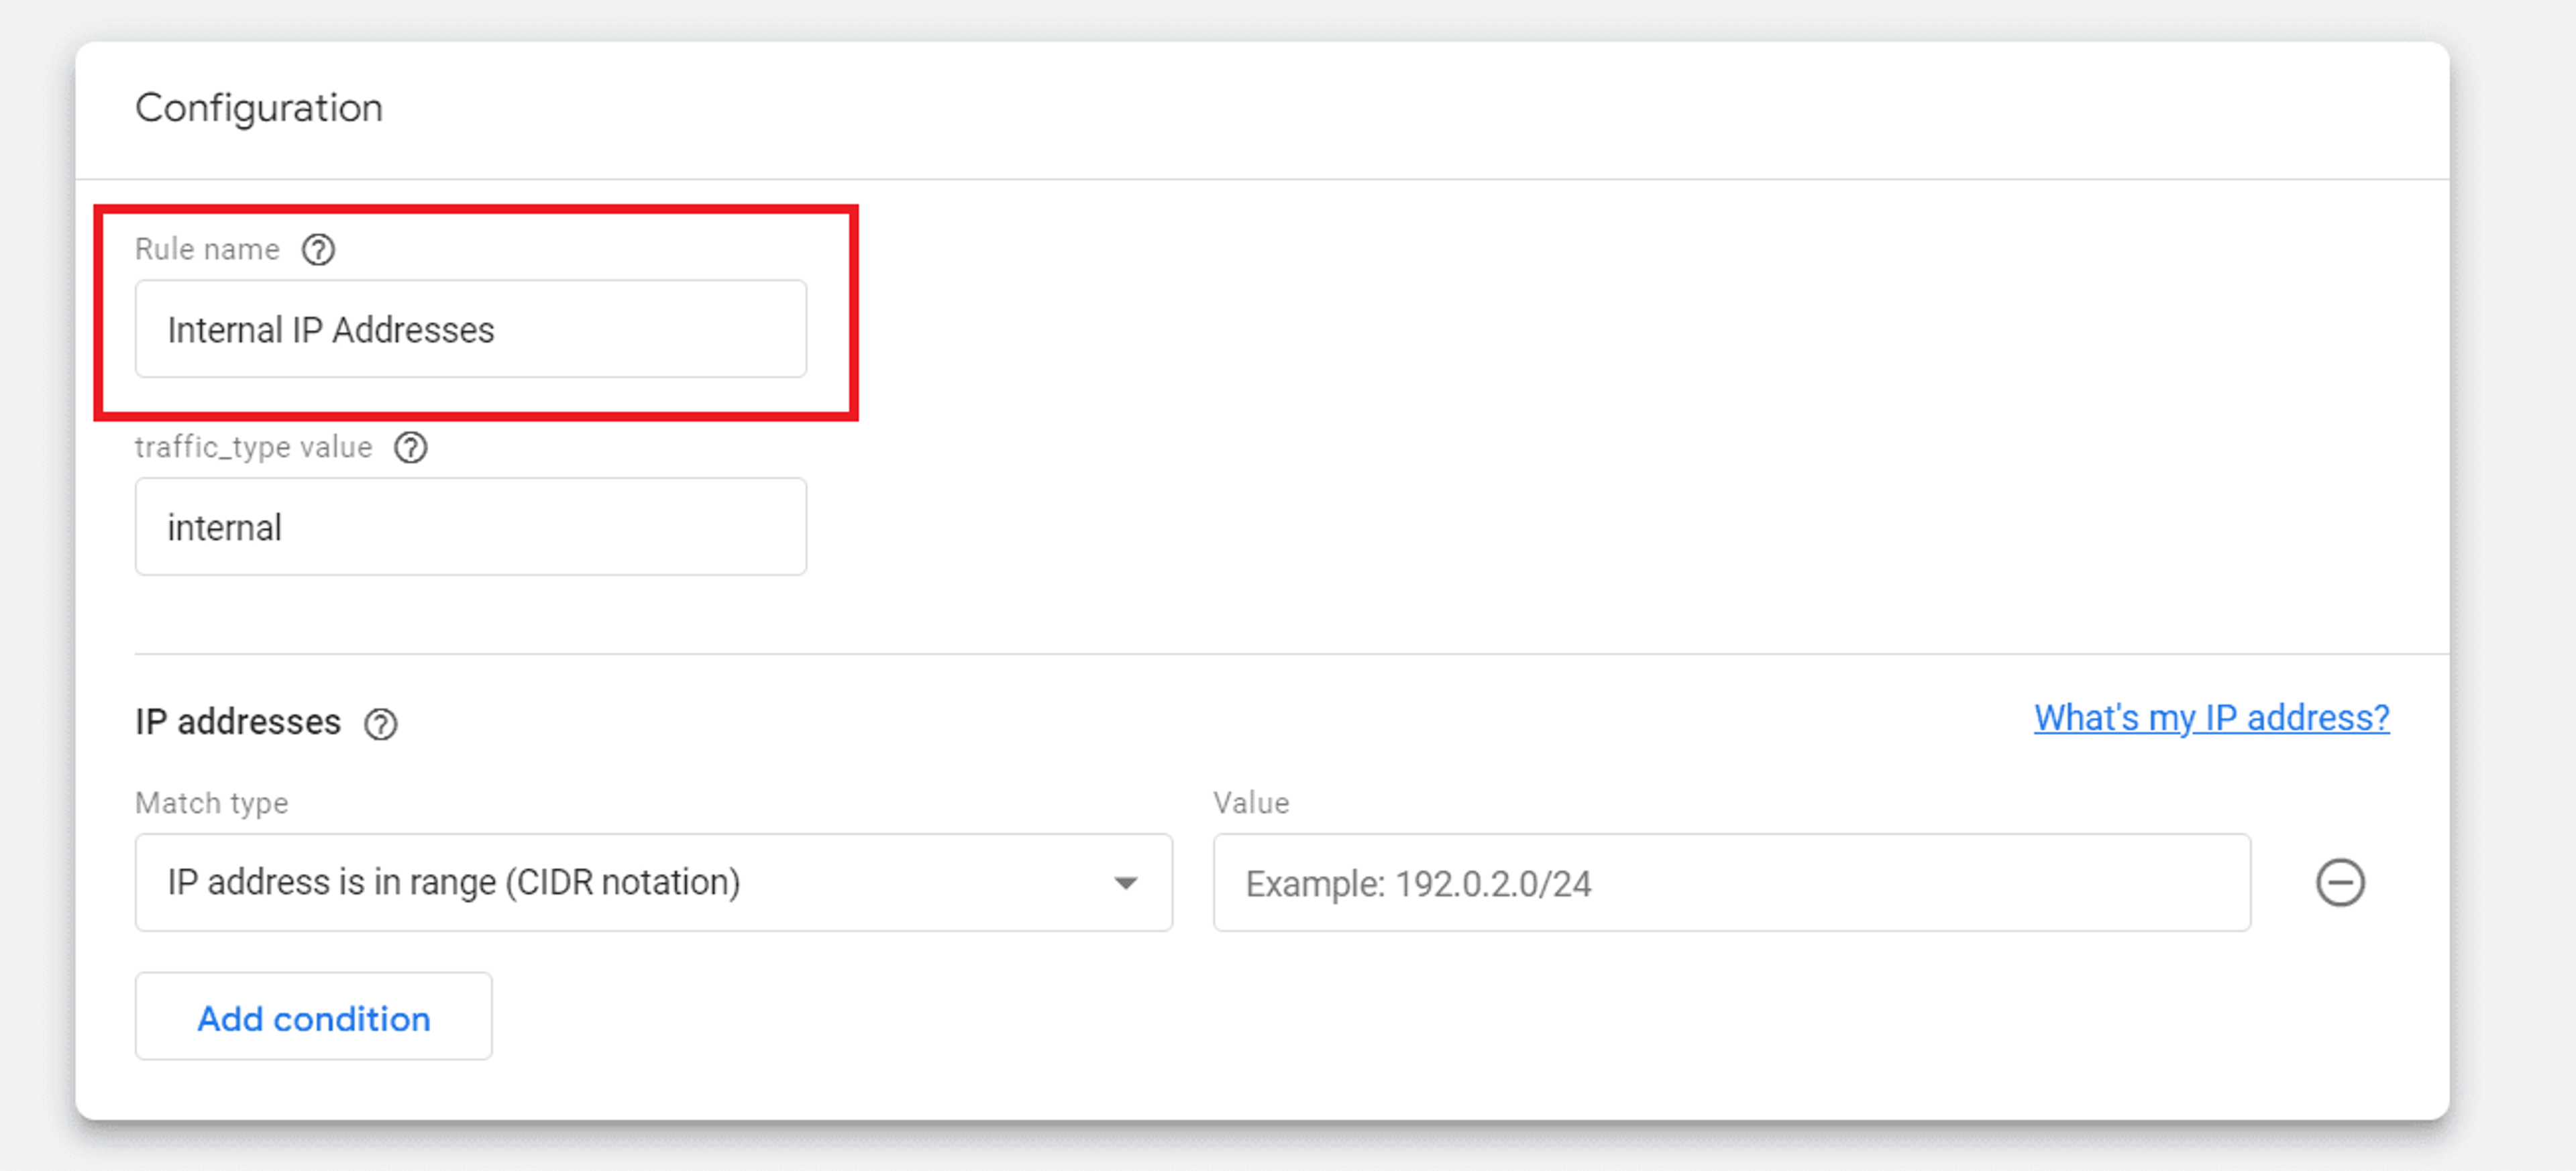
6. Select the match type you need under IP addresses, and then assign it a value. GA4 supports both IPv4 and IPv6 addresses. If you need to include several individual IPs or IP ranges, use the Add condition button.
The following examples show how to identify IP addresses for each operator:
IP address equals: 172.16.1.1
IP address begins with: 10.0.
IP address ends with: .255
IP address contains: .0.0.
IP address is in range (ranges need to be expressed in CIDR notation):
- 24-bit block (e.g., 10.0.0.0 – 10.255.255.255): 10.0.0.0/8
- 20-bit block (e.g., 172.16.0.0 – 172.31.255.255): 172.16.0.0/12
- 16-bit block (e.g., 192.168.0.0 – 192.168.255.255): 192.168.0.0/16
7. Click Create.
This creates the rule. If you have an existing rule that identifies internal traffic and need to edit it, you have to do the following:
- Click Data streams in the Property column under Admin.
- Hit Web, then select a web data stream.
- Click Configure tag settings in the web stream details, and then hit Show all.
- Click Define internal traffic, and then the row for the definition.
- Find a marker icon, click it, make the changes you want, and hit Save.
Next, you will need to create a filter. You can do this by following these steps:
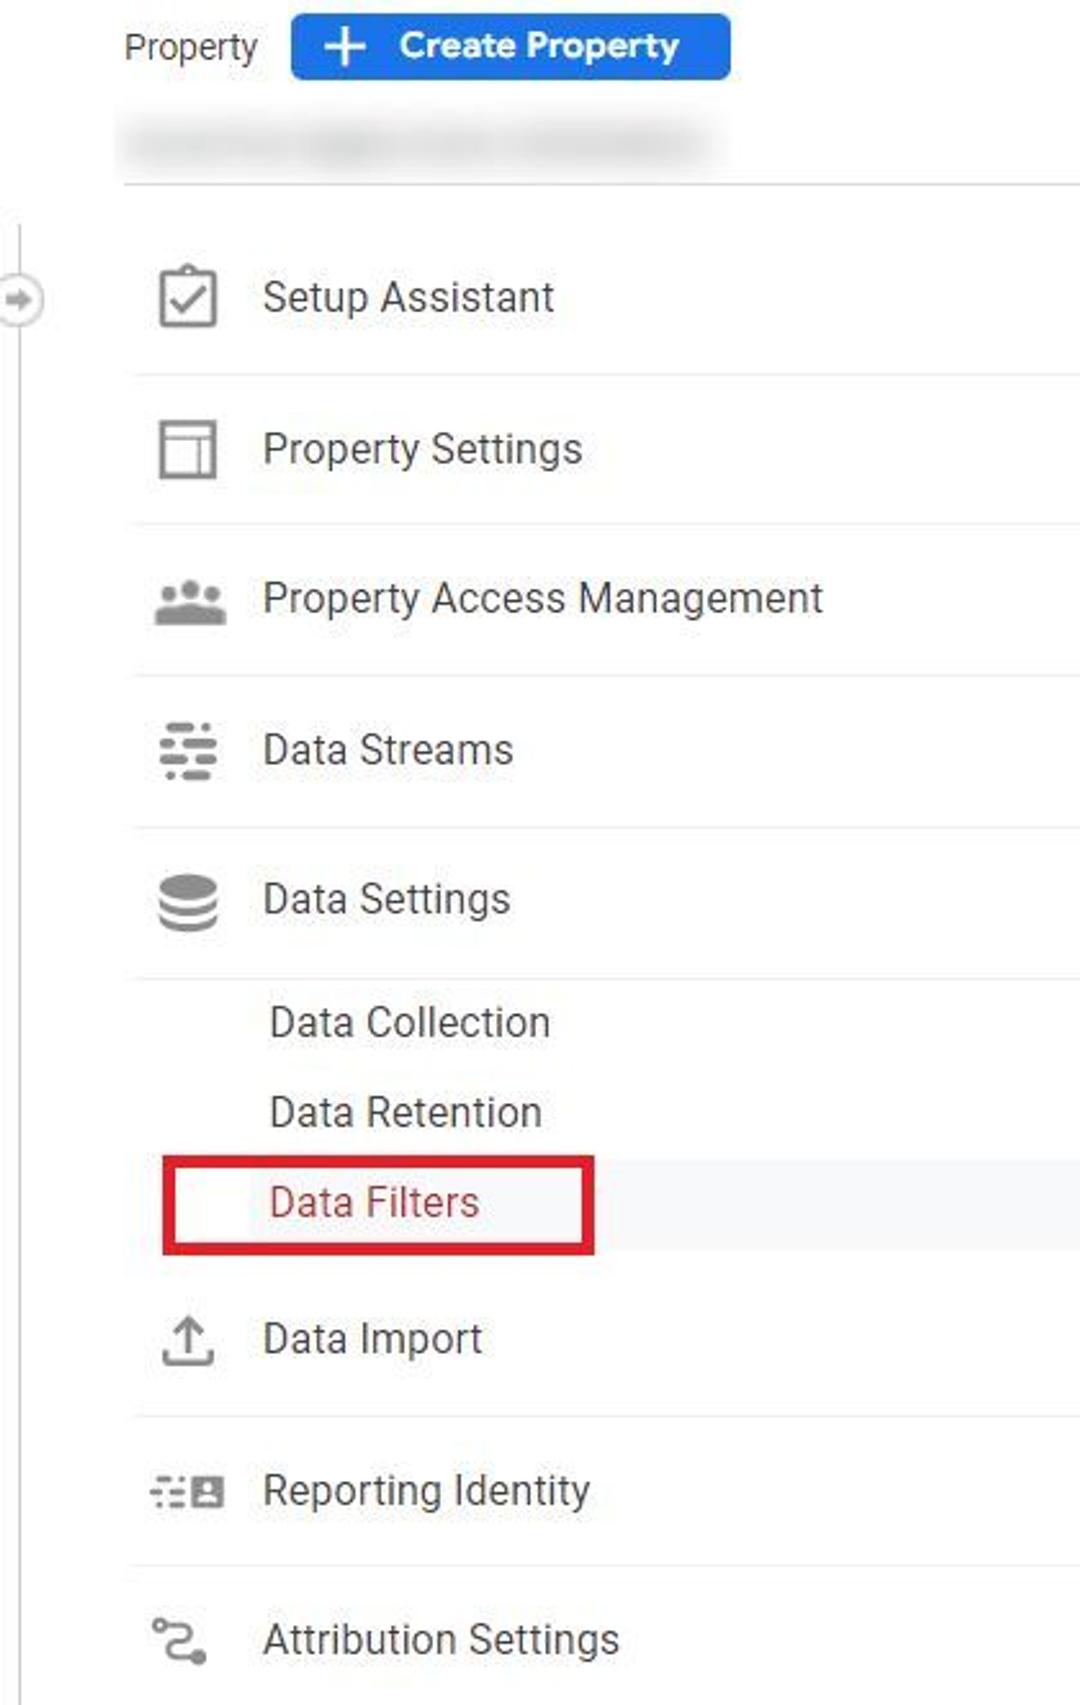
1. Log into your GA4 account and click Data Settings - Data filters in the Property column.
2. Hit Create filter, and enter a name for it. The name must begin with a unicode letter, be unique among all filter names in the same property, and contain only unicode letters, numbers, underscores, and spaces. The character limit for the name is 40 characters.
3. Set Internal traffic as the filter type.
4. Select filter operation. We want to exclude internal traffic, so choose Exclude.
5. Enter the parameter value you created before for the event parameter name traffic_type.
6. At this point, the Summary section should give you a brief explanation of how this filter will operate. If everything seems right, set the filter state to Active.
7. Finally, hit Save filter.
1.2 GA4 transactions check
The only truly certain way to be sure your purchase tracking is working well is cross-referencing GA4’s data with your CMS/customer relationship management (CRM) data using another analytics tool. In the end, keeping all your eggs - or in this case, data - in one basket, is rarely a good idea.
I strongly recommend you use at least one other analytics tool in tandem with Google Analytics. This way, you will be able to make sure that their transaction data match and start making necessary adjustments if they don’t. Generally, an acceptable discrepancy is considered to be below 10%, but this value depends on the tool you choose to use.
1.3 Ecommerce tracking health check
In this step, we will determine whether your ecommerce tracking is working properly. For this, you should make a test purchase in your online store and pay close attention to how it is tracked.
To make this test as useful as possible, make sure to use every feature your store has in your shopping session. Browse different product categories. Add products to the shopping cart, both from the category page and from the page of an individual product. Click on the reviews tab. Watch a testimonial, if you have them. You get the idea.
You should perform every action that a customer could undertake on your online store. Record what you do, especially if there are a lot of features to be tested. Then, when you are out of buttons to press and the checkout is finished, go to Google Analytics and pull up a detailed overview of your purchase.
Which events fired? How many times did they fire? Were they the events that should have fired? It is this type of question you should ask yourself.
If everything works the way it should, consider yourself lucky and give whoever set up your GA4 a pay rise.
If not, don’t be discouraged; it is entirely normal to face problems when you are doing something for the first time. Take a deep breath, make yourself a cup of coffee or tea, and start figuring out where the problems are.
1.4 Fixing the tracking of your landing pages
By default, a GA4 session period is set to 30 minutes. This means that when a user goes inactive for more than half an hour on your website, the session restarts from scratch with no landing page data.
Remember that your customers have lives outside your online store. They could get an important call that distracts them from thinking about your products. Their smartphone’s battery might die. They might get a reprimand from their boss for browsing your store at work. Or they could be distracted by a million other things that will make them go inactive on your site for more than 30 minutes.
When they come back, you will have no data to tell you from where they started their journey on your website. This is a problem. To solve it, we recommend adjusting the session timeout to at least 4 hours. And while you’re at it, make sure that the start of a session fires the right event of page_view.
1.5. Funnel exploration report fix
It is hard to overestimate the importance of this part of GA4. When implemented correctly, this report allows you to monitor how well your sales funnel performs on different devices.
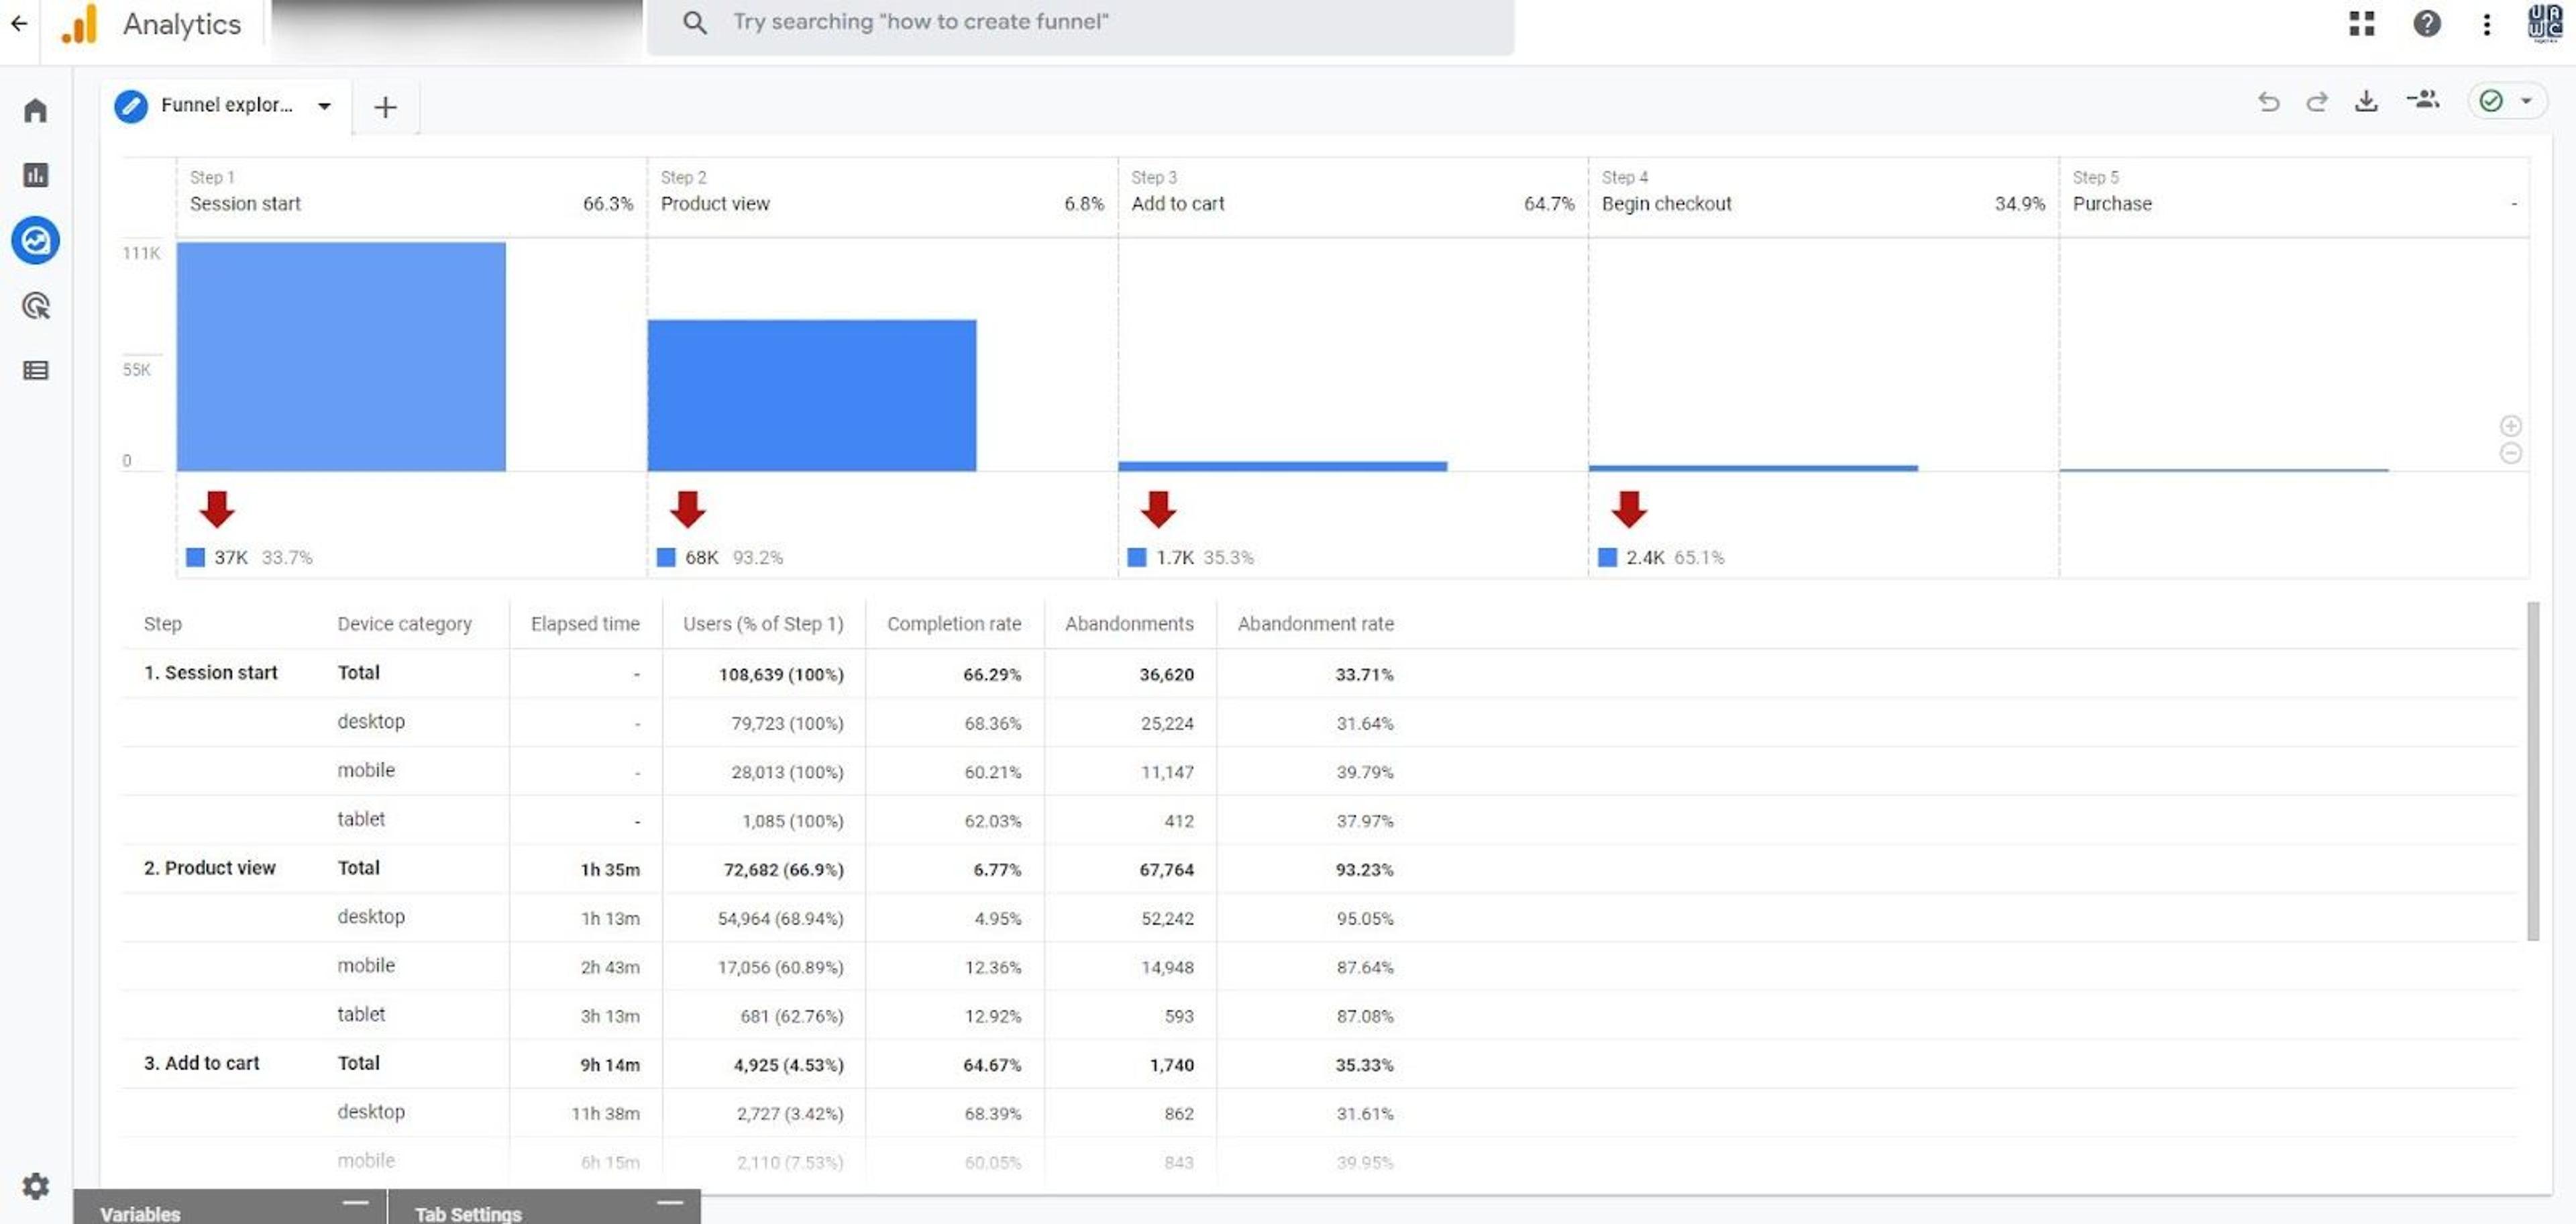
Here, you can check the number and percentage of users that have dropped out at different stages of the funnel. This data can help you choose the right direction for your conversion rate optimization (CRO).
However, you first need to make sure that the numbers you see reflect reality. Remember what I told you about checking if the right events were firing at the right time? I hope you fixed that. If you didn’t and the user’s actions were tracked incorrectly, the data given to us in the funnel exploration report will be all but useless.
1.6. Percentage of direct traffic
The direct traffic segment describes the percentage of traffic that has reached your website without a user’s browser going via a referrer.
Somebody opens your website from their bookmarks – that’s direct traffic. Somebody manually types in your website’s URL and presses enter – direct traffic. A click on a link passed through a secure channel that Google can’t track (at least officially), like Facebook Messenger or WhatsApp – also direct traffic.
As you can imagine, traffic of this type is rather uncommon. The hard truth is, not many of your customers will enjoy your services so much they’ll bookmark you. And even if they do remember your shop’s name the next time they need to buy something you offer, it is unlikely they will finish typing its top-level domain name (the .org or .com part) before hitting enter.
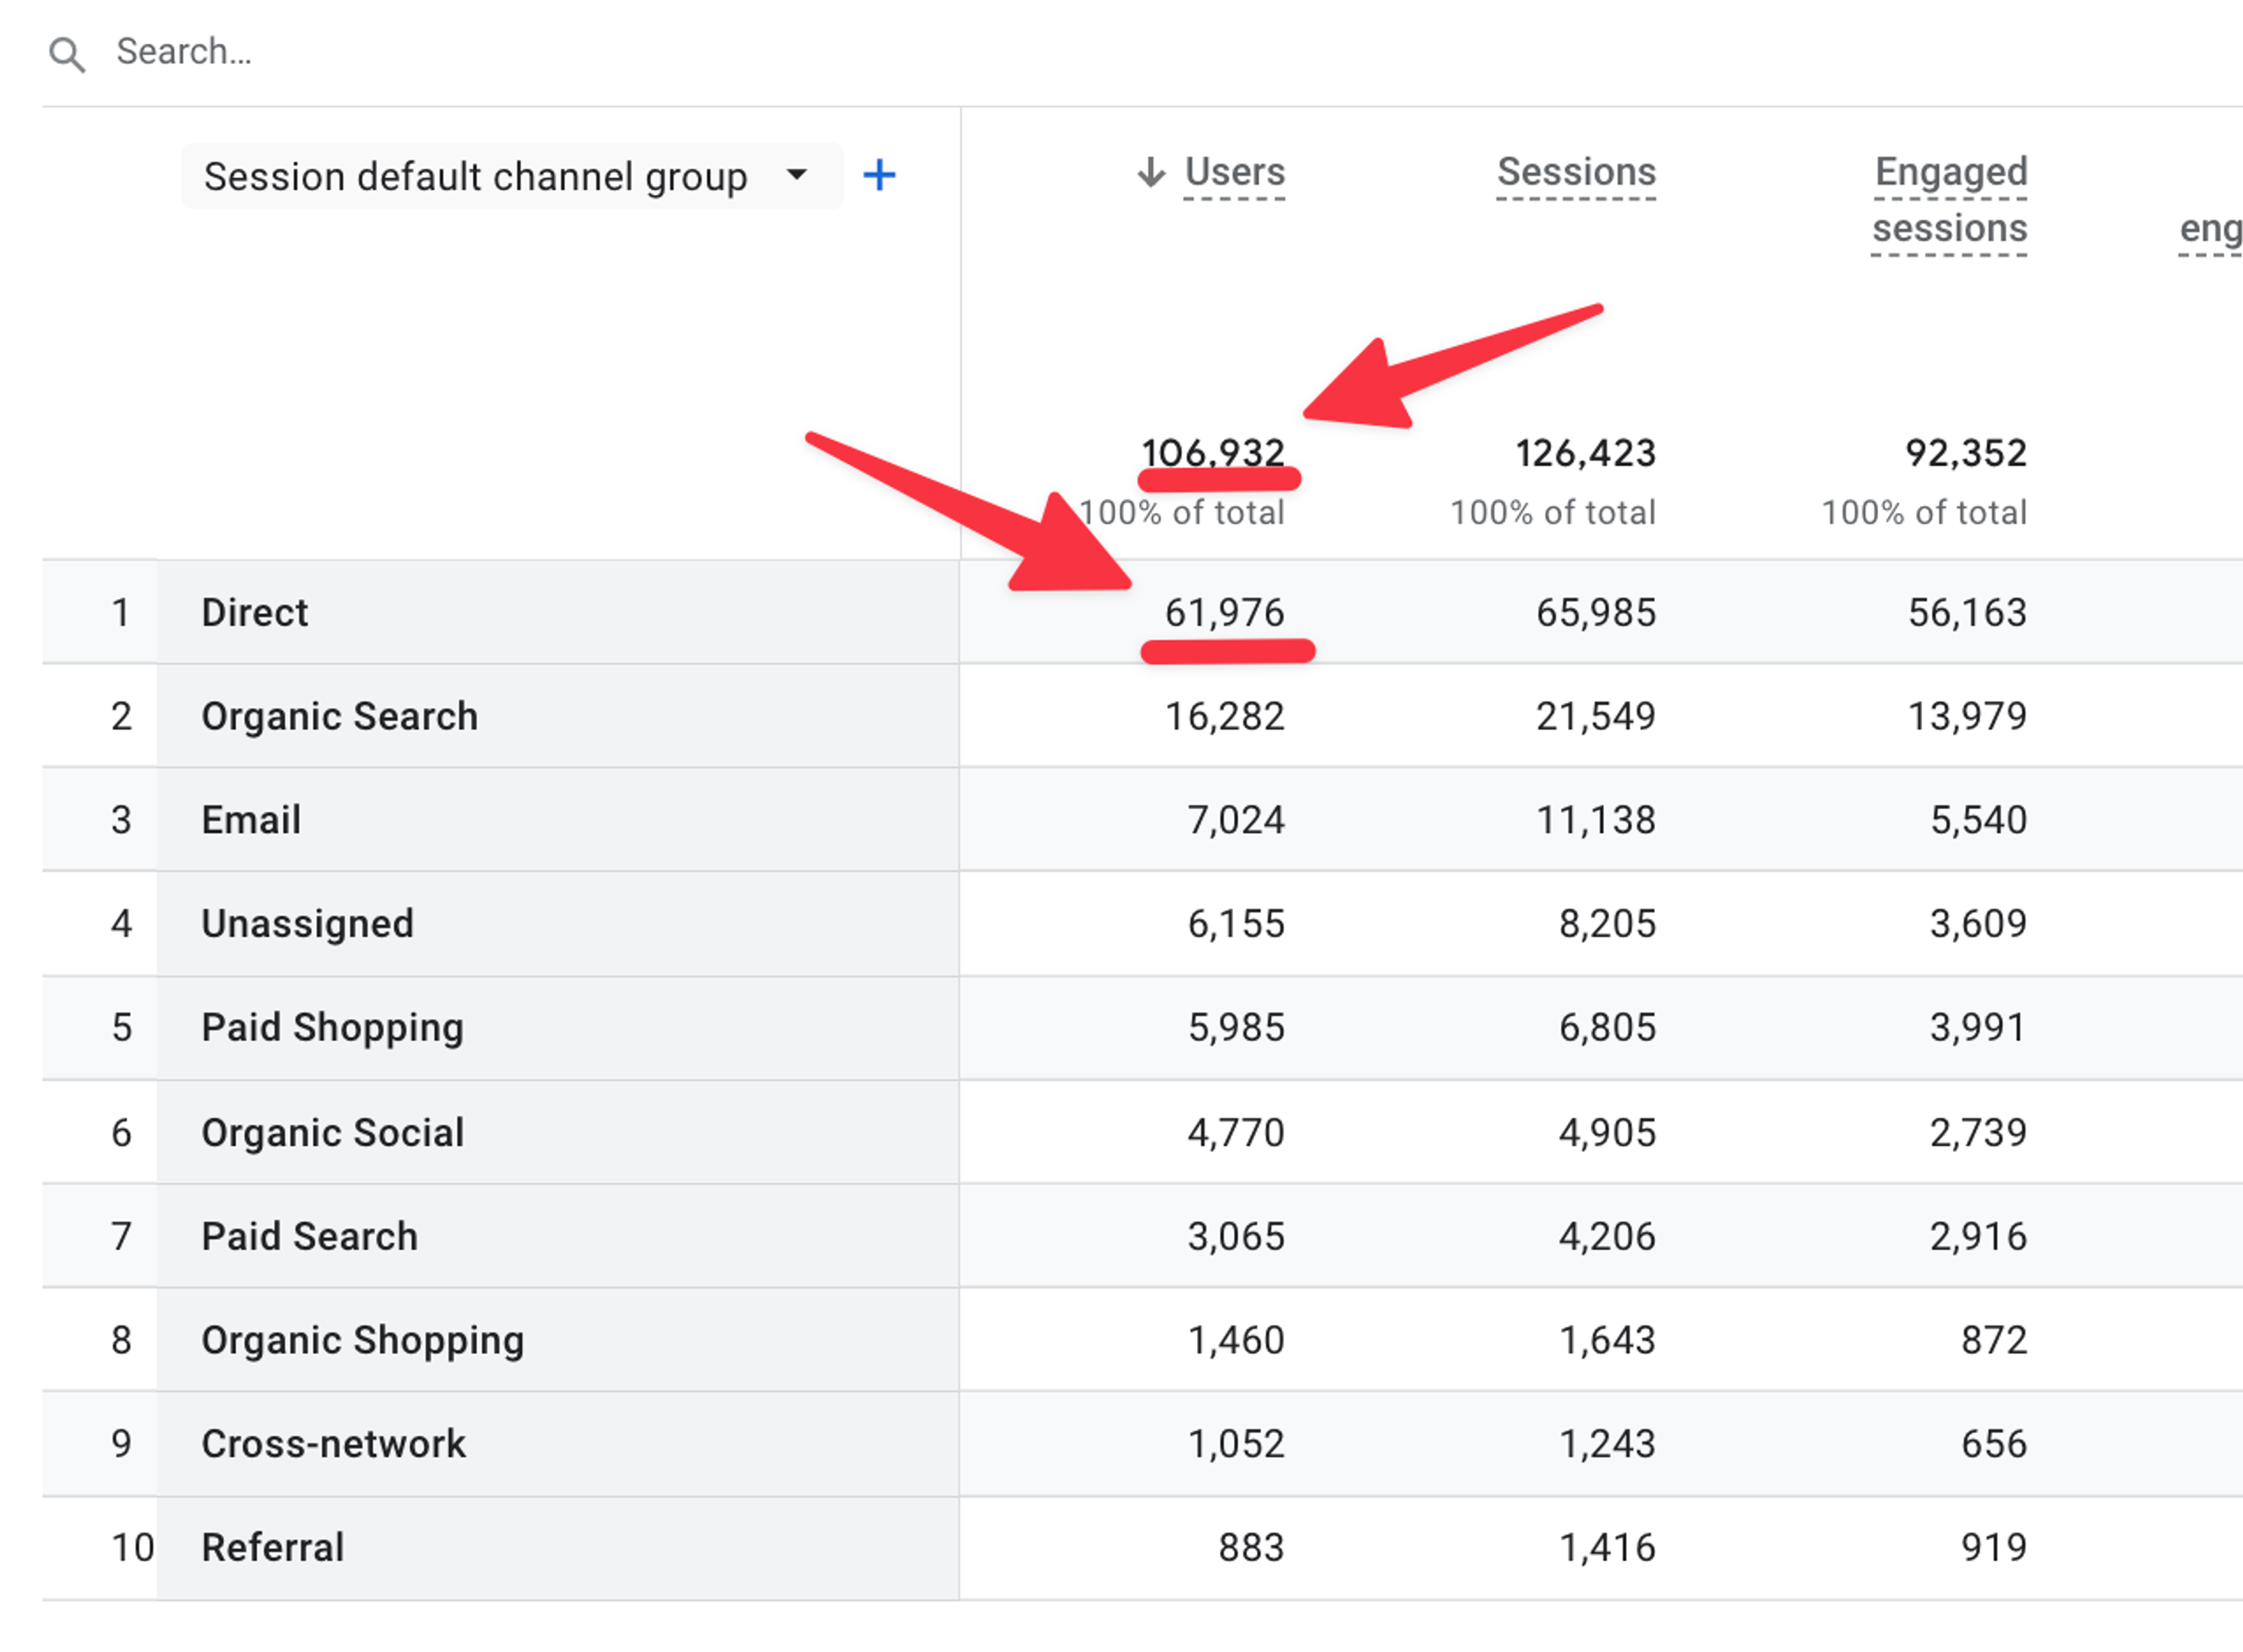
Therefore, if your direct traffic share is unusually large (say, 25% or higher), it is a clear sign that there is something wrong with your attribution settings. The most common issue I have encountered is related to inappropriate Google Analytics tagging of the landing page. You should start your search for the root of this problem there.
1.7. “Unassigned” traffic sources
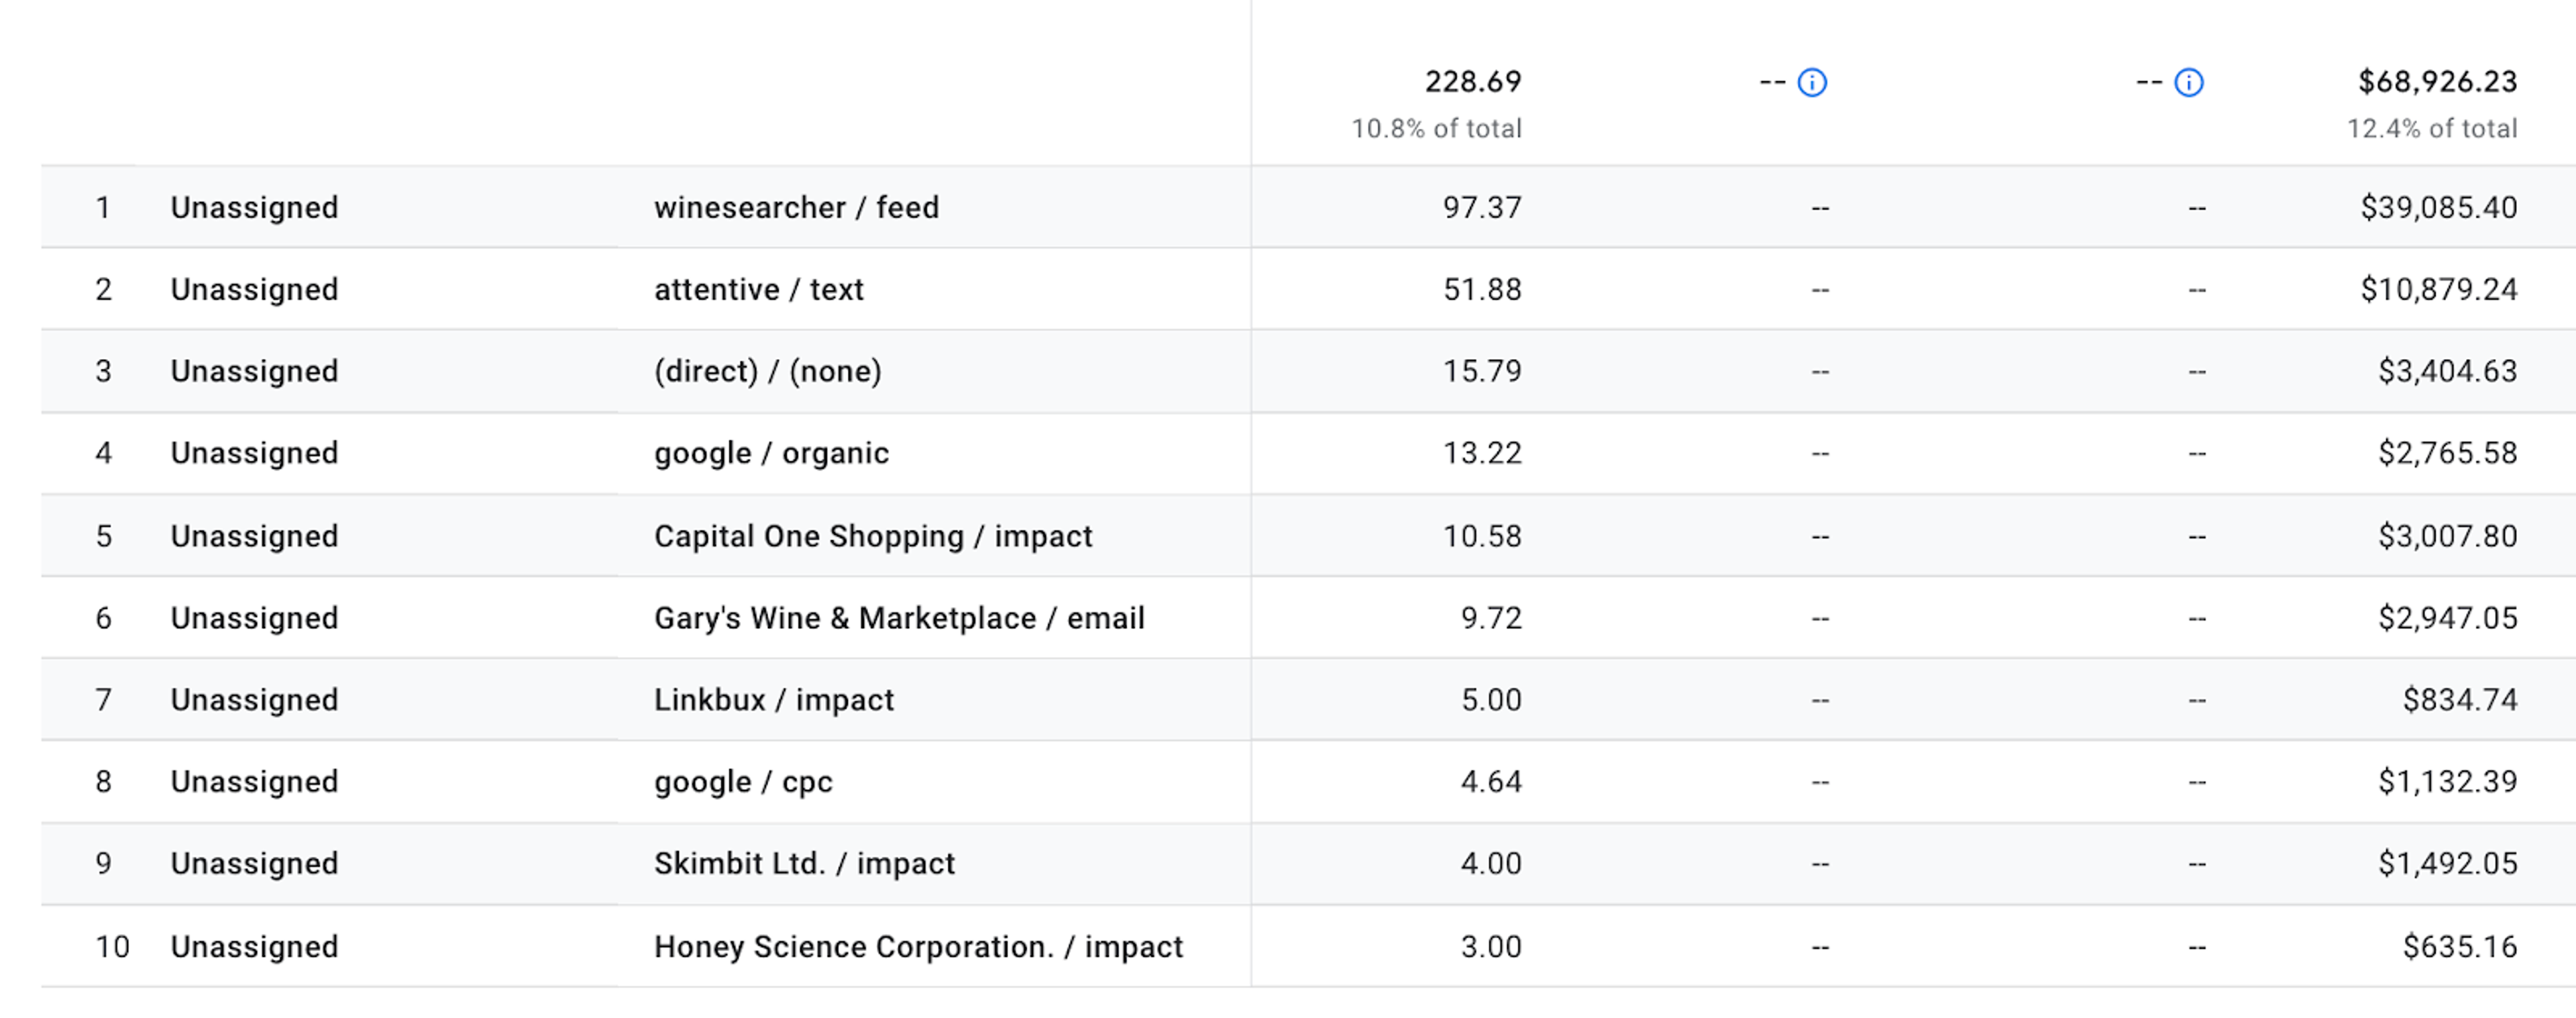
When there are no channel rules matching the event data of a traffic source, Google Analytics assigns it a value as Unassigned. Too many traffic sources like this can be another symptom of incorrect implementation of UTM parameters. If the image above seems familiar, I suggest having a good look at these sources.
1.8. Demographics reports
By default, this tab will probably provide you with something like this:
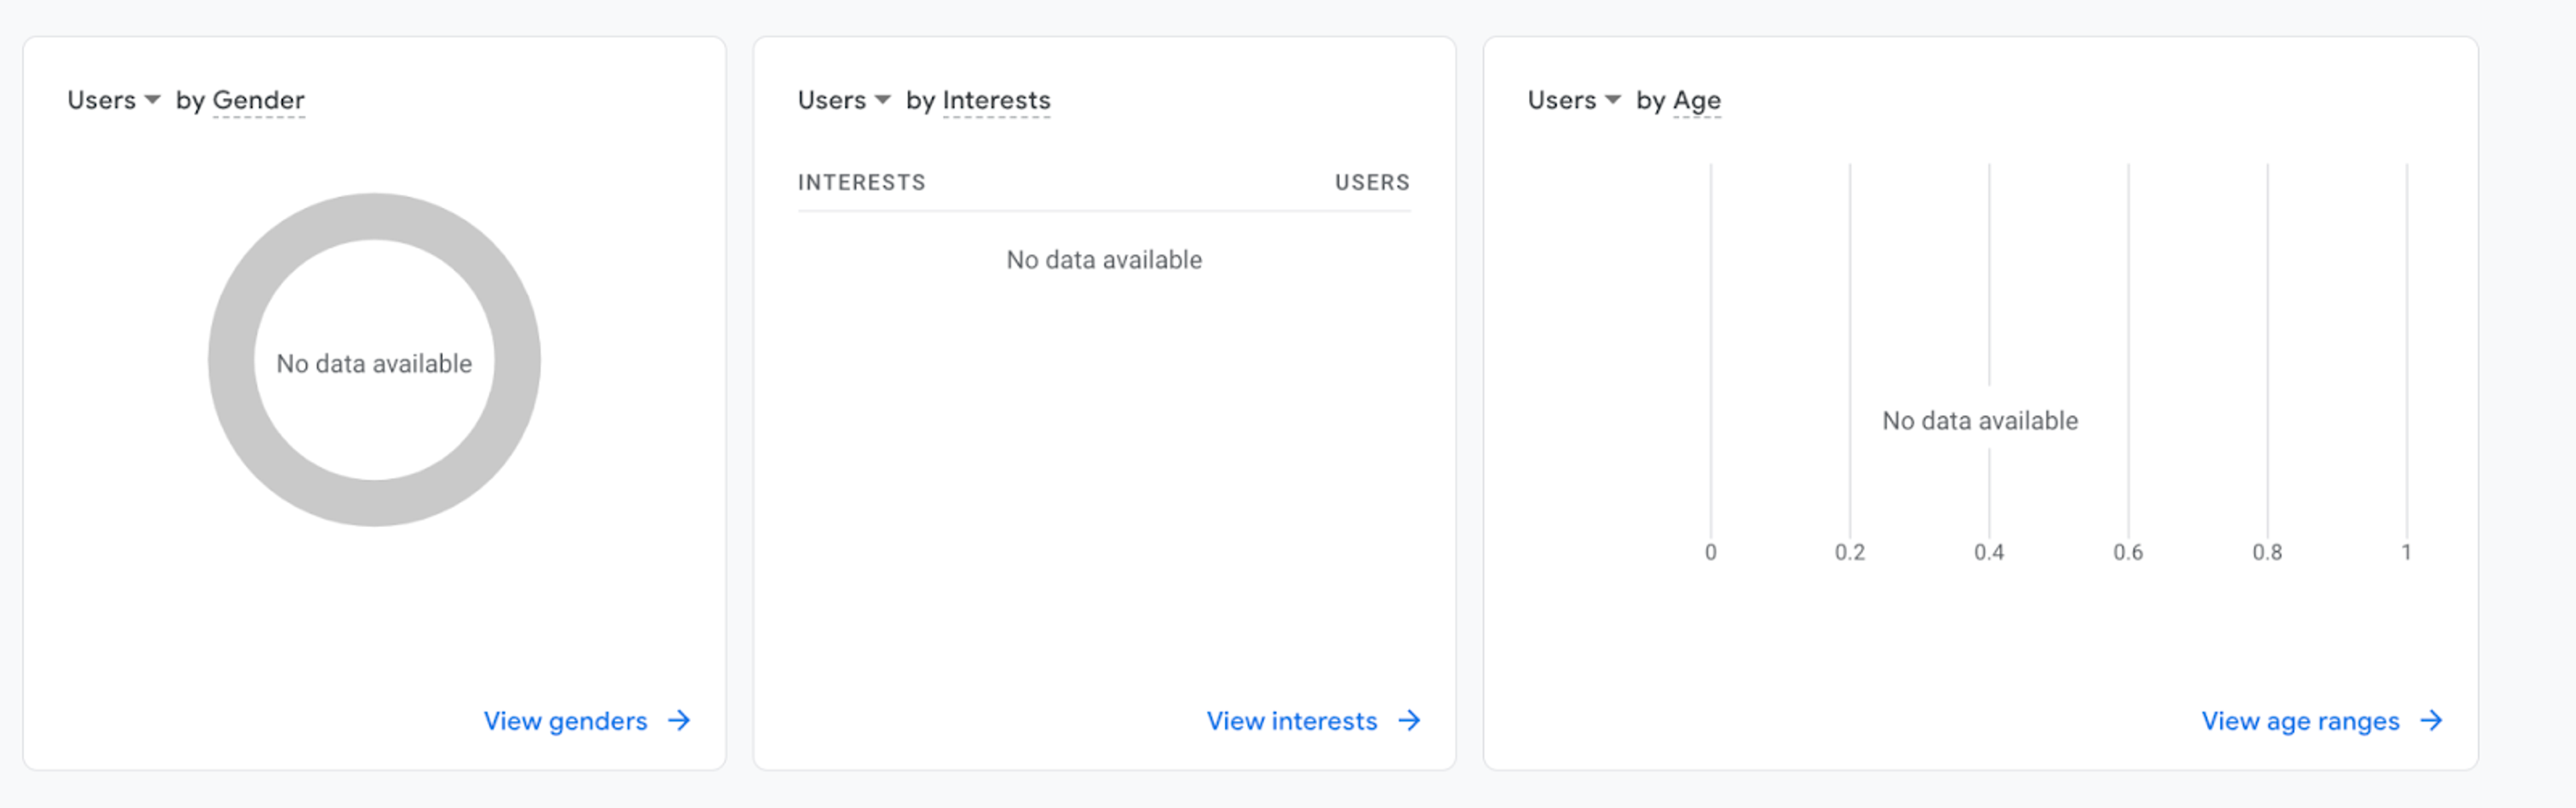
Given that the whole point of Google Analytics is collecting data, this is probably not a sight that makes you happy. Age, gender, and data related to interests can be crucial in tailoring your marketing to the audiences that are likely to buy your products.
To fix this, you will need to follow a few simple steps.
1. Log into your GA4 account and choose the property you want.
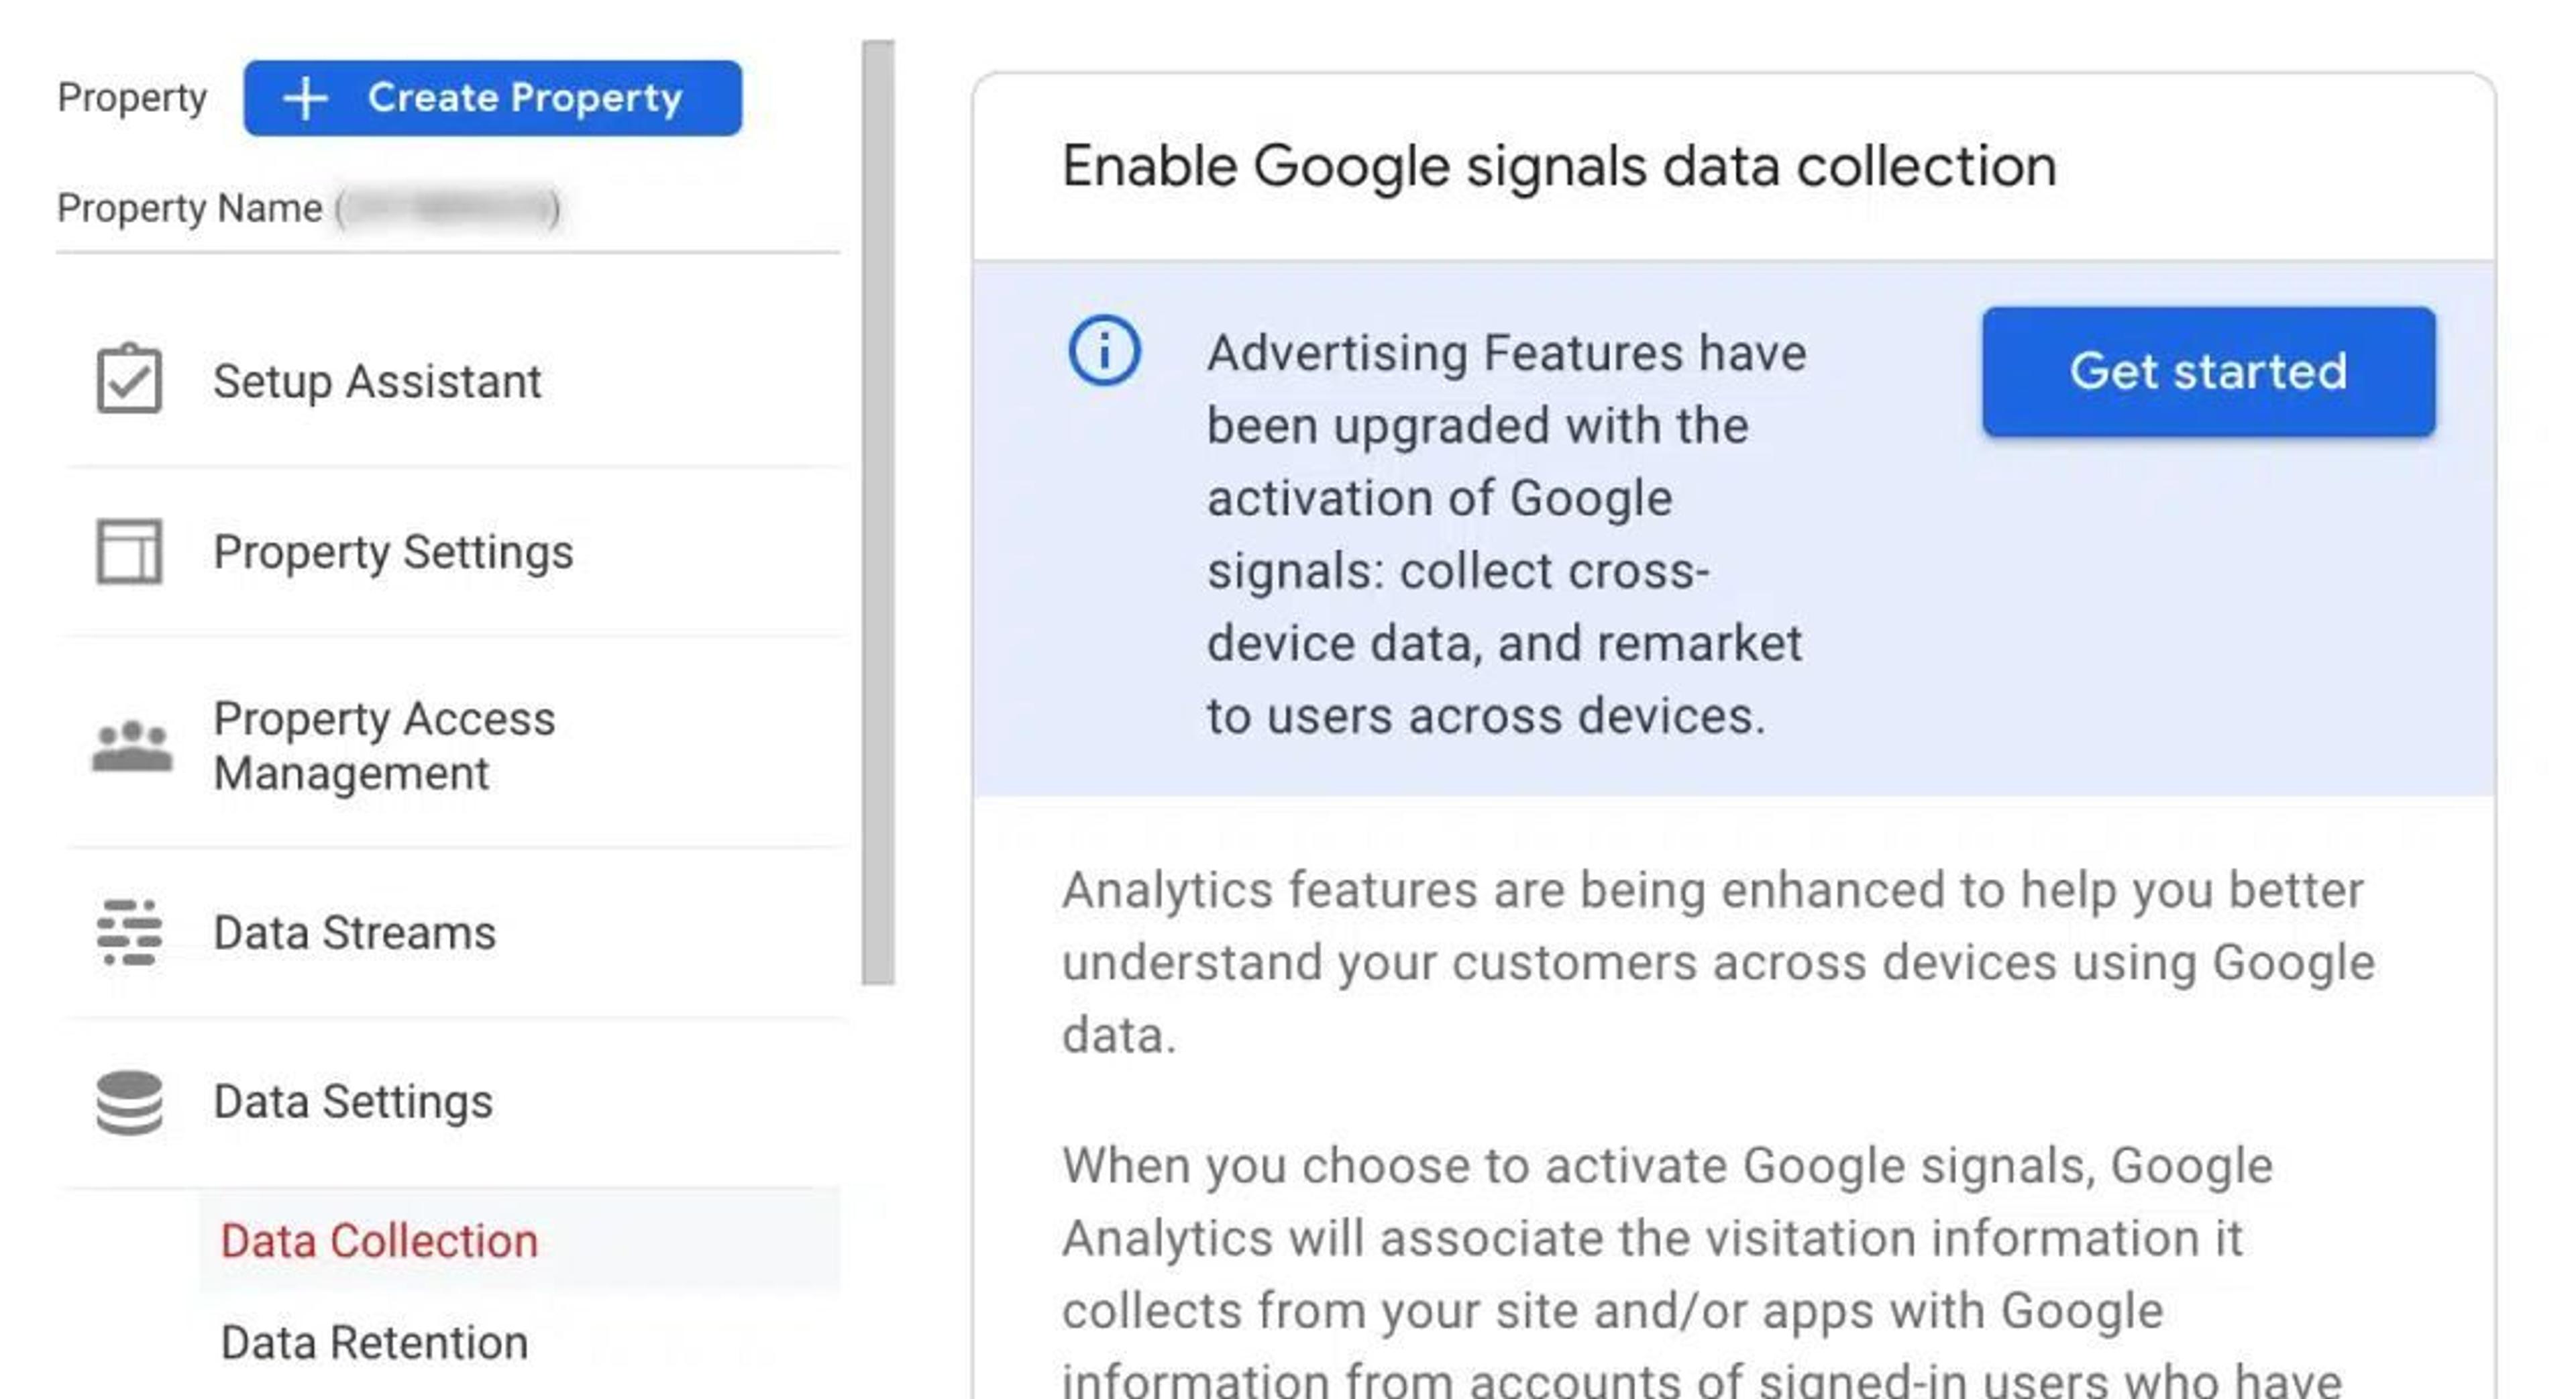
2. Hit the Admin button in the left lower part of your screen.
3. Find Data Collection under Data Settings and hit the blue Get Started button.
4. Follow Google’s instructions. They’ll tell you what to do here.
If this part of GA4 is now working as it should, the next thing you’ll want to do is take a look at your location report. Depending on your type of business, seeing the geographic regions from which your traffic is arriving can be game changing.
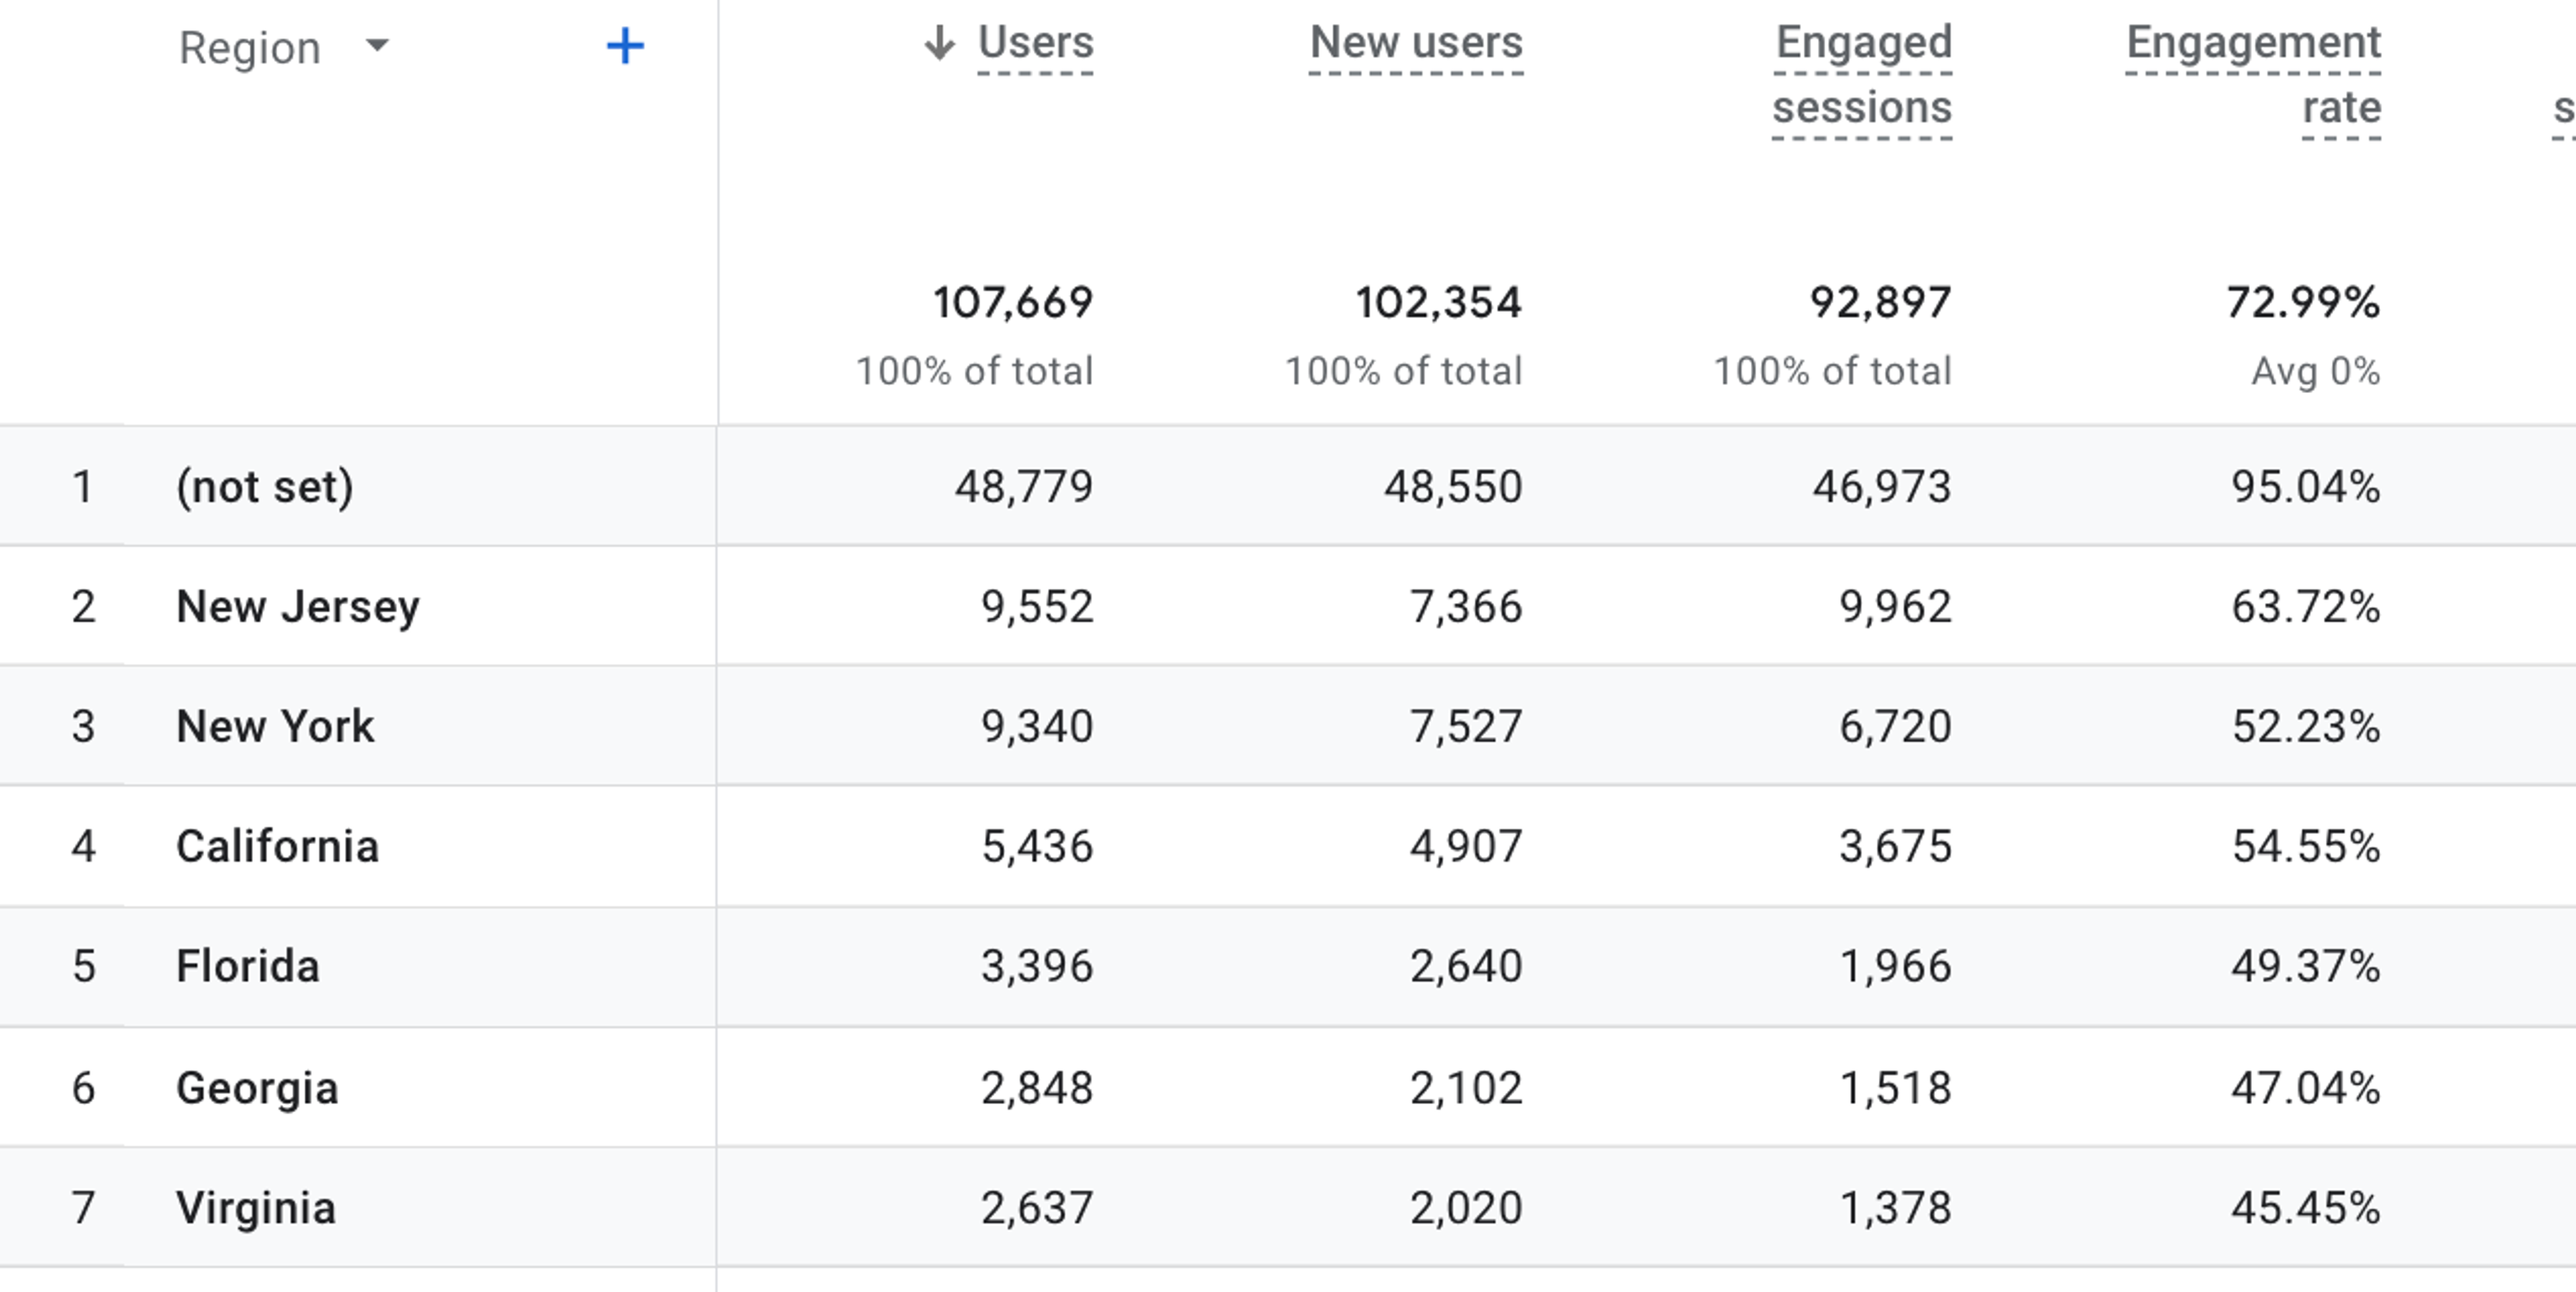
If you are seeing something similar to the image above, there is a chance you have a problem. This is not always the case, though. The most common culprit of a large (not set) percentage is the use of proxies or IP addresses that can not be traced by Google.
Therefore, before you start looking for a technical solution, ask yourself a simple question: Is there a reason your audience may want to use VPN services when accessing your website? Consider if you are dealing in the kind of products that might be blocked by parental controls or the traffic control tools that are used in some workplaces. Or is it that you attract the kind of audience that simply tends to value their privacy?
(If you are dealing in something like chemical supplies, you may actually want to avoid looking into your customers’ data too much.)
Sometimes, the issue can be in your domain name. If you are using a top-level domain name of some lesser-known country, there’s a surprisingly high chance that some of your local internet service providers are blocking it for one reason or another. In this case, your customers would have to use a VPN to access your store, meaning they fall into the (not set) location segment.
If my suggestions don’t describe your problem, I suggest assigning the (not set) users under a separate segment.
Having done that, once you have obtained enough data describing these users, start looking for similarities among them. Most likely, there is a device, internet provider, or browser-specific bug that is interfering with your statistics.
1.9. Other events and conversions
One of the key differences between GA4 and Universal Analytics is their definition of what an event is. Things that would be classified as different hit types in Universal Analytics are now all events in GA4.
What was counted in the hit type Transaction/ecommerce is now an event.
The Page View hit type is an event.
User timing is also an event now.
What this ultimately means from our perspective is that there are now more events for you to customize and track.
1.9.1. Scroll events
Do you want to know whether your website pages are engaging enough? If so, you need to pay attention to scroll events.
By default, the automatically tracked scroll event in GA4 has the scrolldepth value of 90%. This means that your Google Analytics will tell you the number and percentage of website visitors that scroll through 90% of a web page.
As you can imagine, this is not optimal. First, nowadays, not many users have this kind of attention span. Second, this does not reflect their engagement well enough.
If a user has to scroll through 90% of your webpage to get to the parts of it you want them to see, your website design needs work. Usually, the most important content and elements you want your users to engage with are located toward the top of the web page. This is a basic design principle.
Therefore, to get more meaningful data, I recommend setting up additional scroll events for scrolling through 25%, 50%, and 75% of the page. The precise numbers will depend on where your key content is. Run a few tests to determine the key points. If the piece of content you want your visitors to see requires scrolling through 29% of the page, set this scroll percentage as an event. Your data can never be too precise.
1.9.2. Add to cart events
Keeping track of when a user adds your products to their shopping cart is important for any ecommerce business. You might think that this is synonymous with a purchase, but it is not. Not every item added to a cart will be bought. However, adding a product to a cart is a clear sign of a customer’s interest to purchase said product.
By default, Google Analytics does not track the add_to_cart events. Here is how you can start tracking them:
1. Create a New Tag from your Workspace.
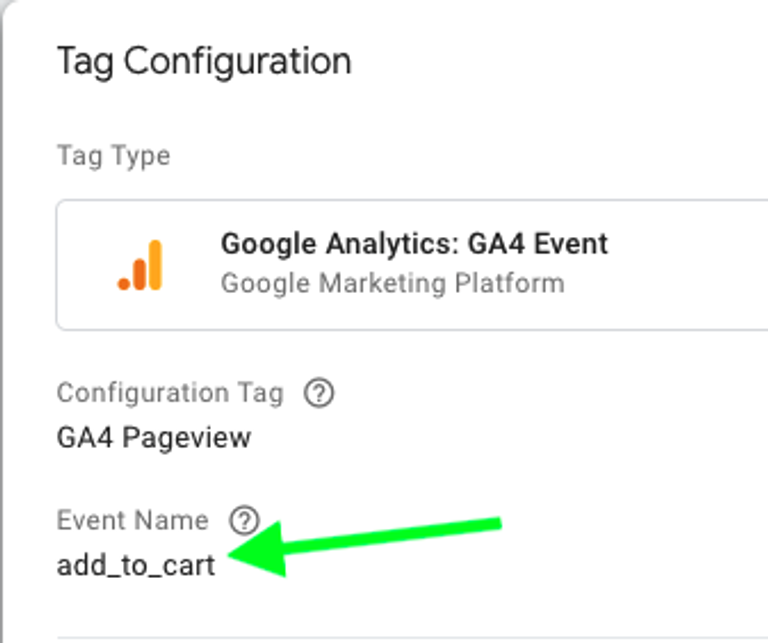
2. Under Tag configuration, select the Google Analytics: GA4 Event Tag type.
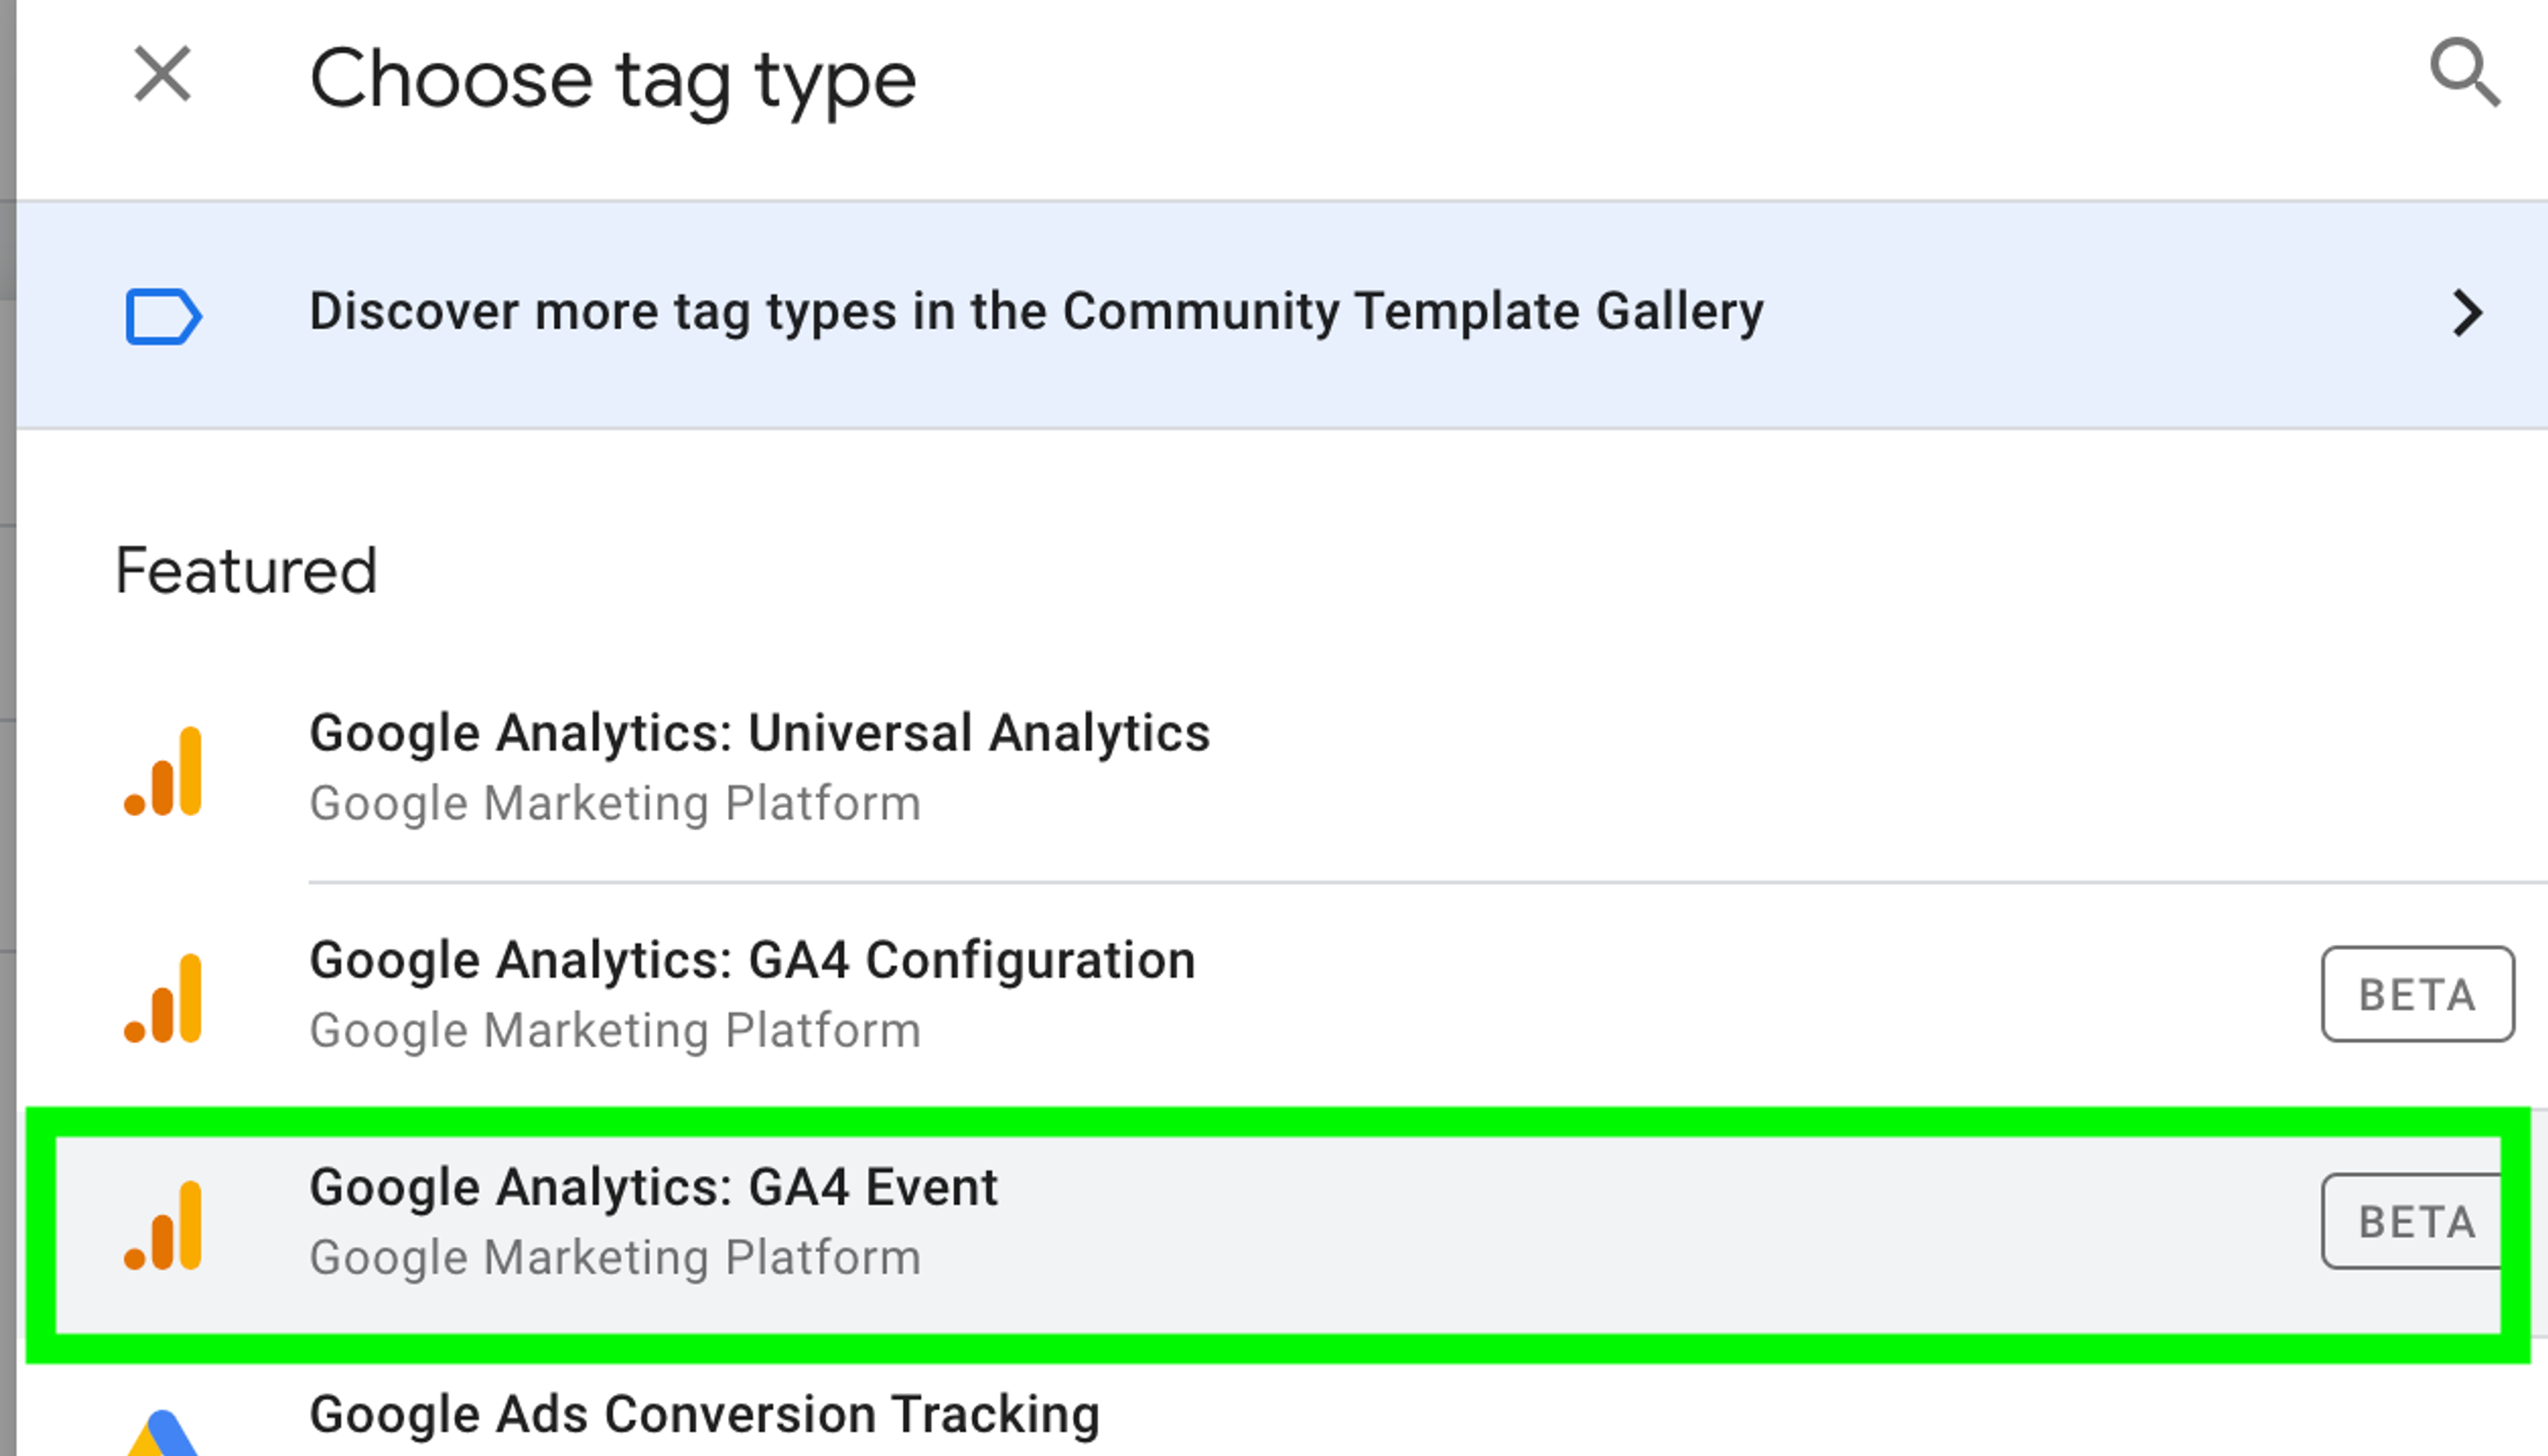
3. Select your Configuration Tag under the Configuration Tag drop-down list.
4. Type add_to_cart into the Event Name field to set the event name.
5. Assign the items for your Event Parameter. For this, use the items variable you created during the Purchase Event setup.
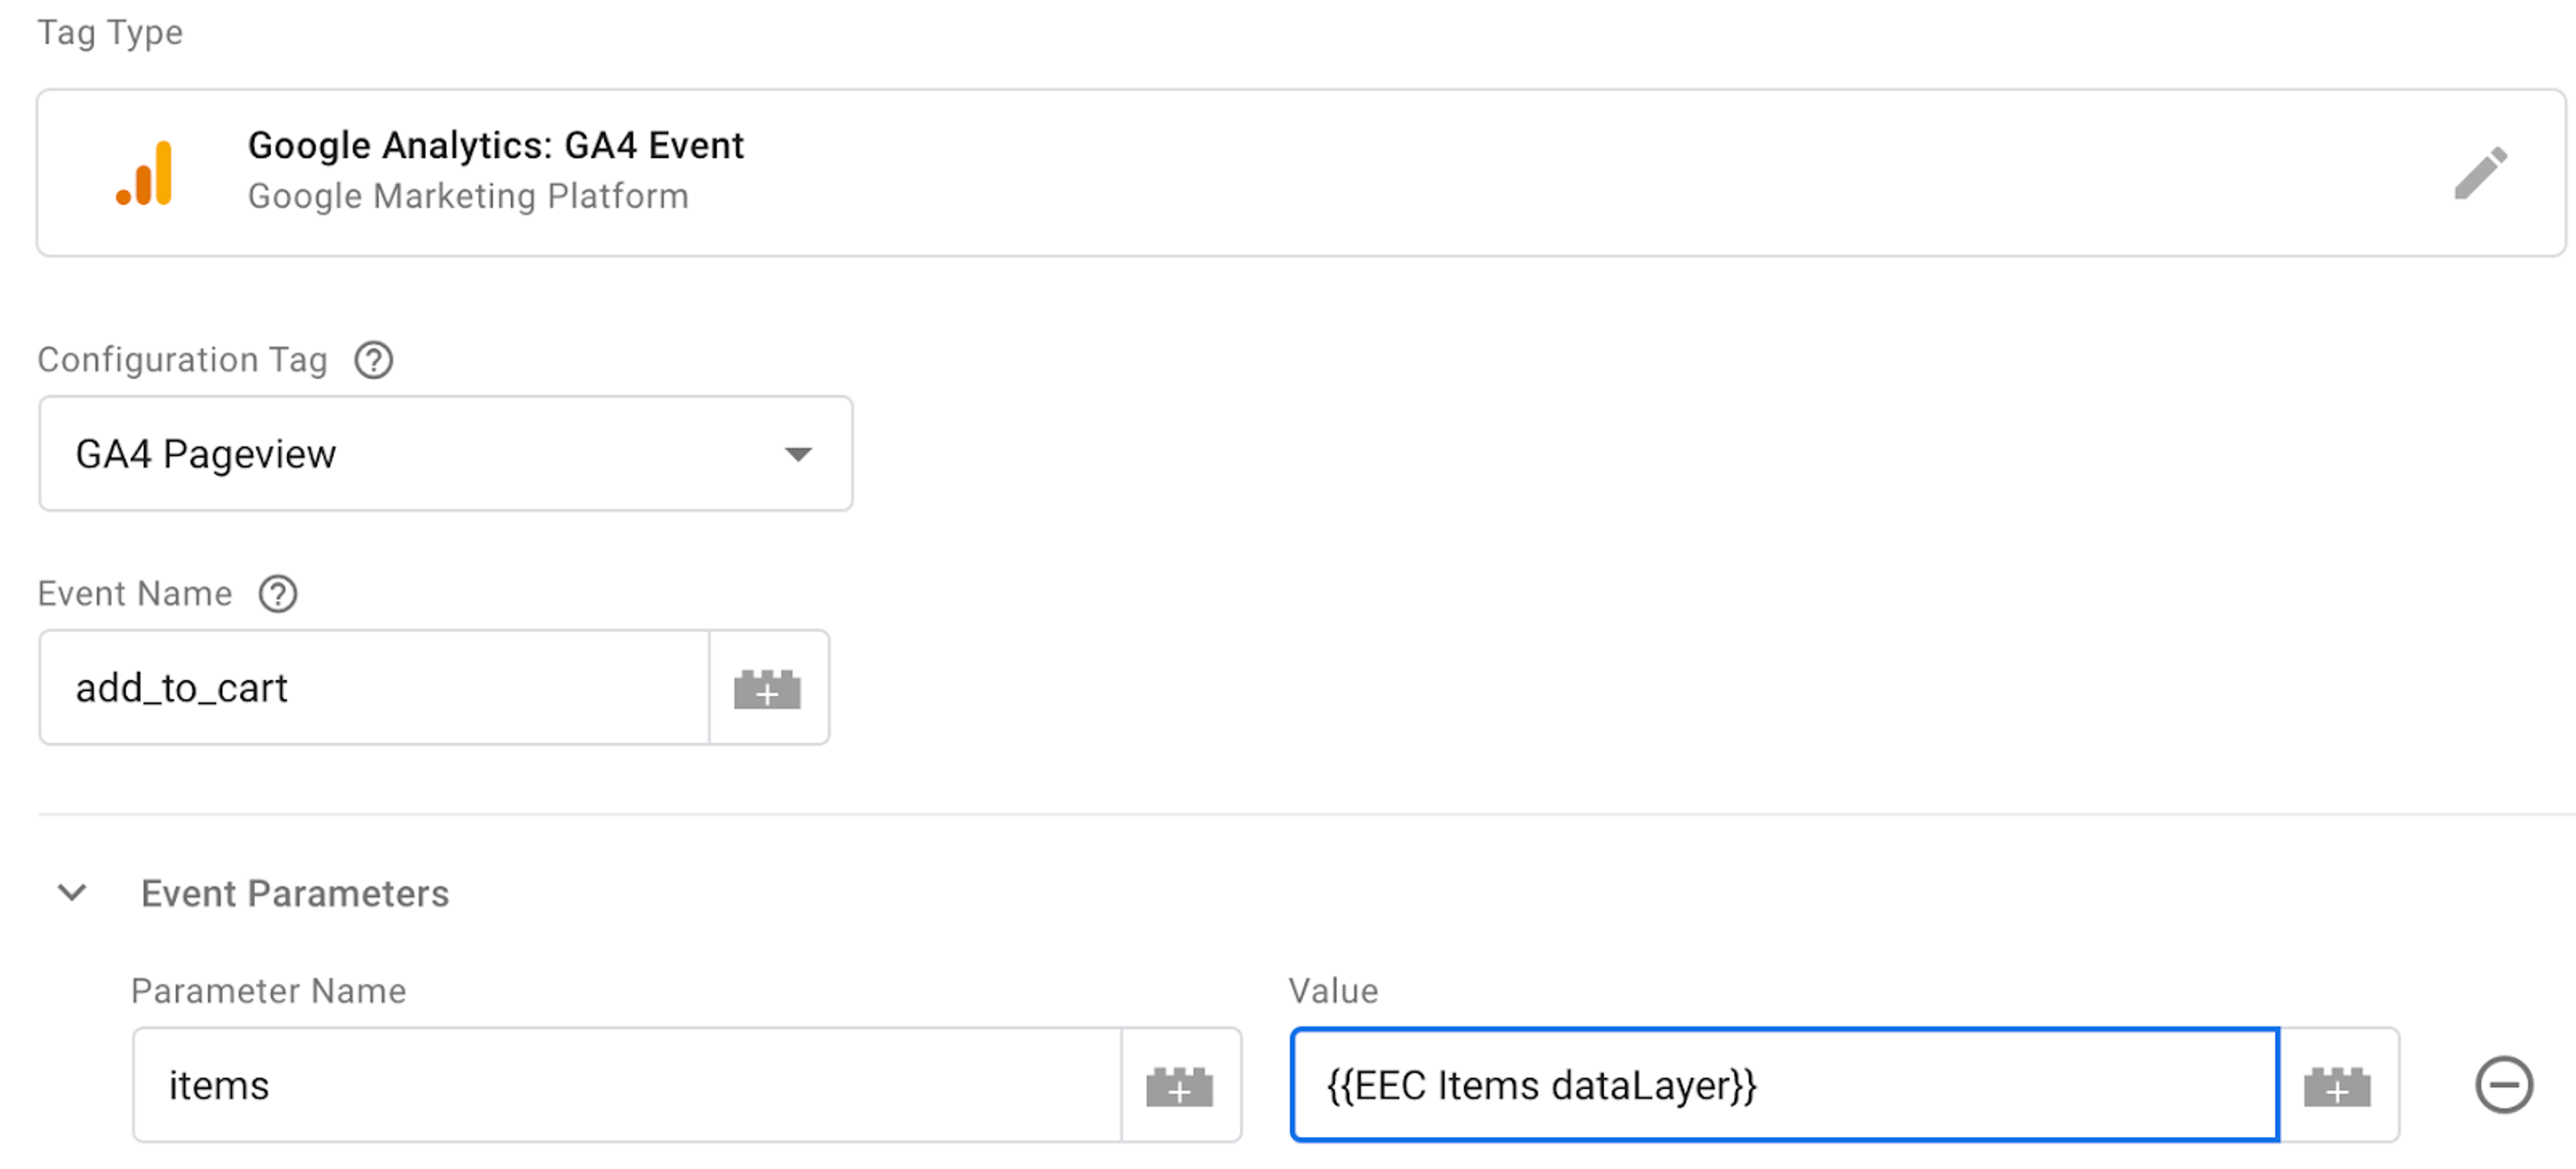
At this point, the items variable will be reading from the product item array in your dataLayer. Keep in mind that this will only work if your product pages have the dataLayer on them.
6. Now, you will need to create a trigger for when you want your tag to fire. For this, create a new trigger.
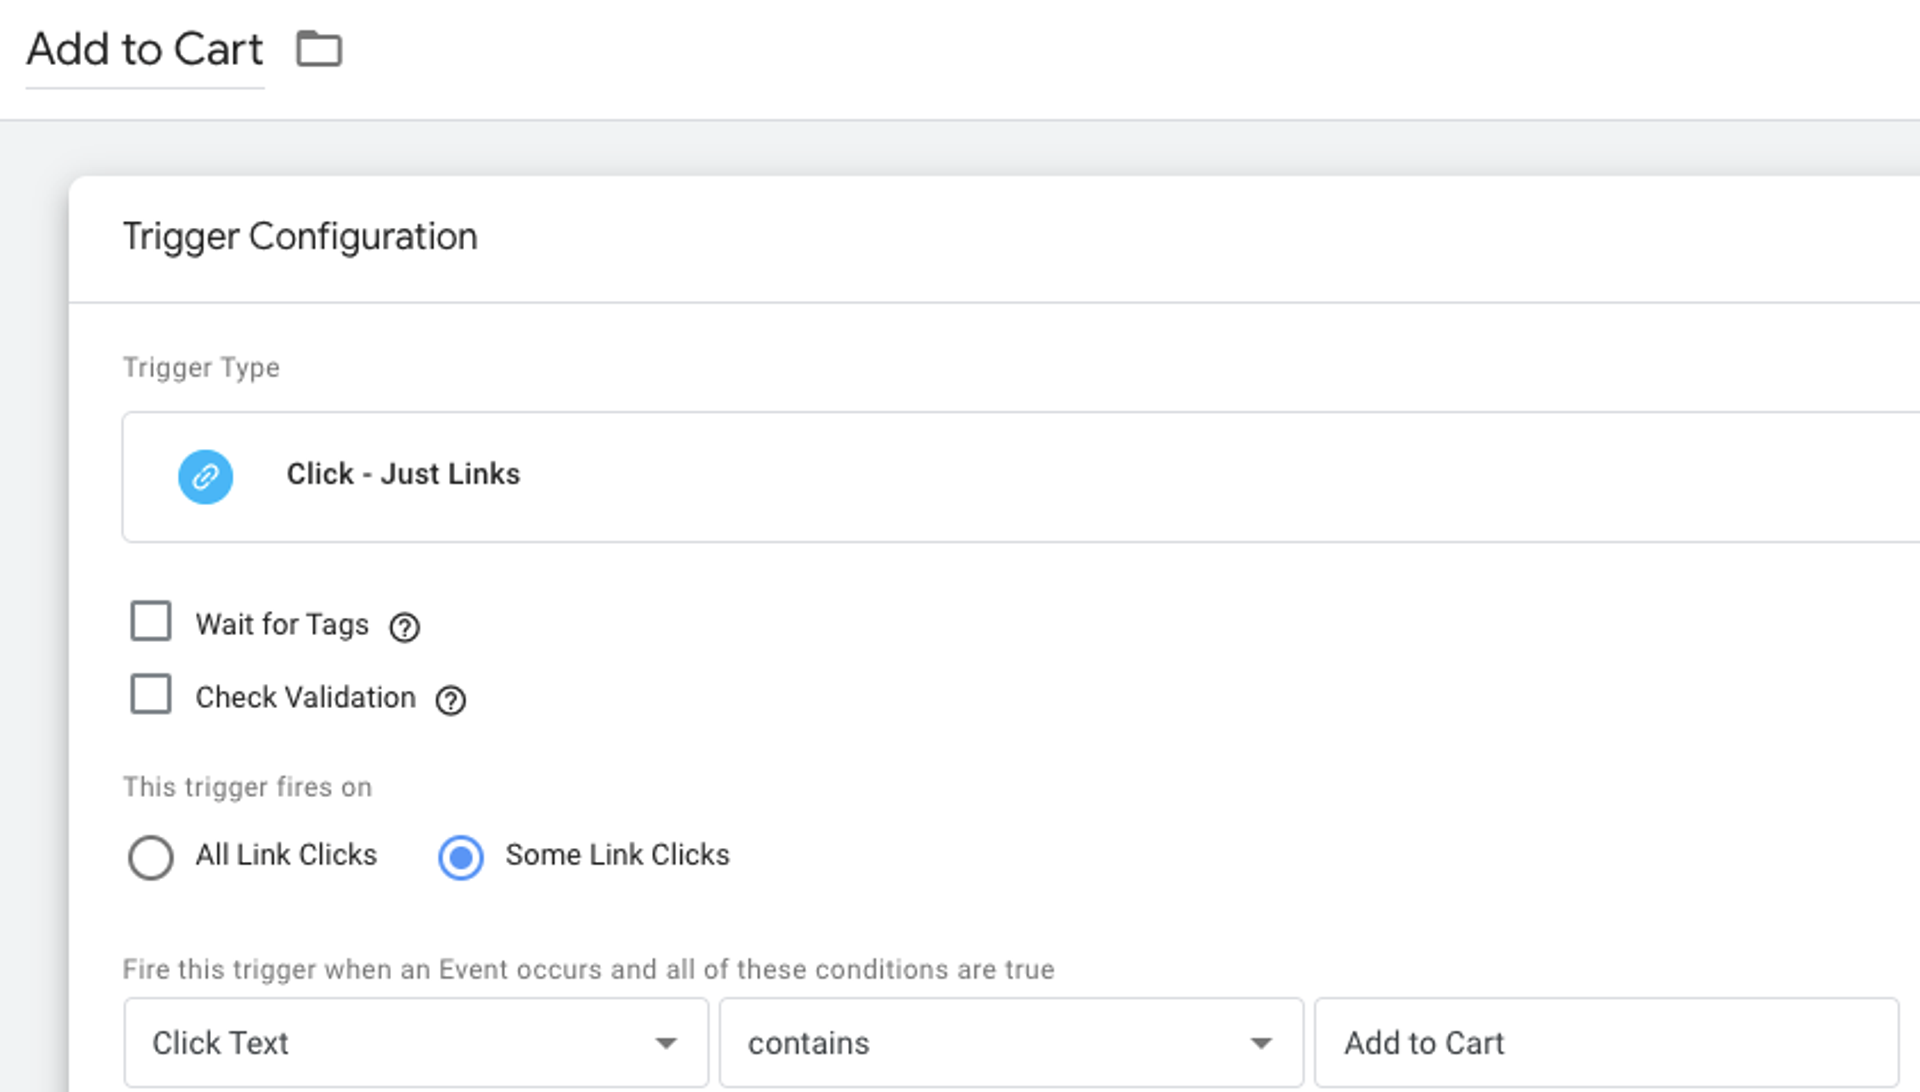
7. Set the trigger type as ‘Click - Just Links’ and select Some Link Clicks under the heading ‘This trigger fires on’.
8. Create a new condition with the variable ‘Click Text’, matching type ‘contains’, and value ‘Add to Cart’. Note that the value should match the text you use on your buttons that add items to the cart. So if your site is not in English, the required text will be different.
Congratulations! If everything has been implemented correctly, GA4 should now be tracking all add to cart events on your website. While we’re here, you might also want to set this event as a conversion. For that, do the following:
1. Click on Admin and select Conversions.
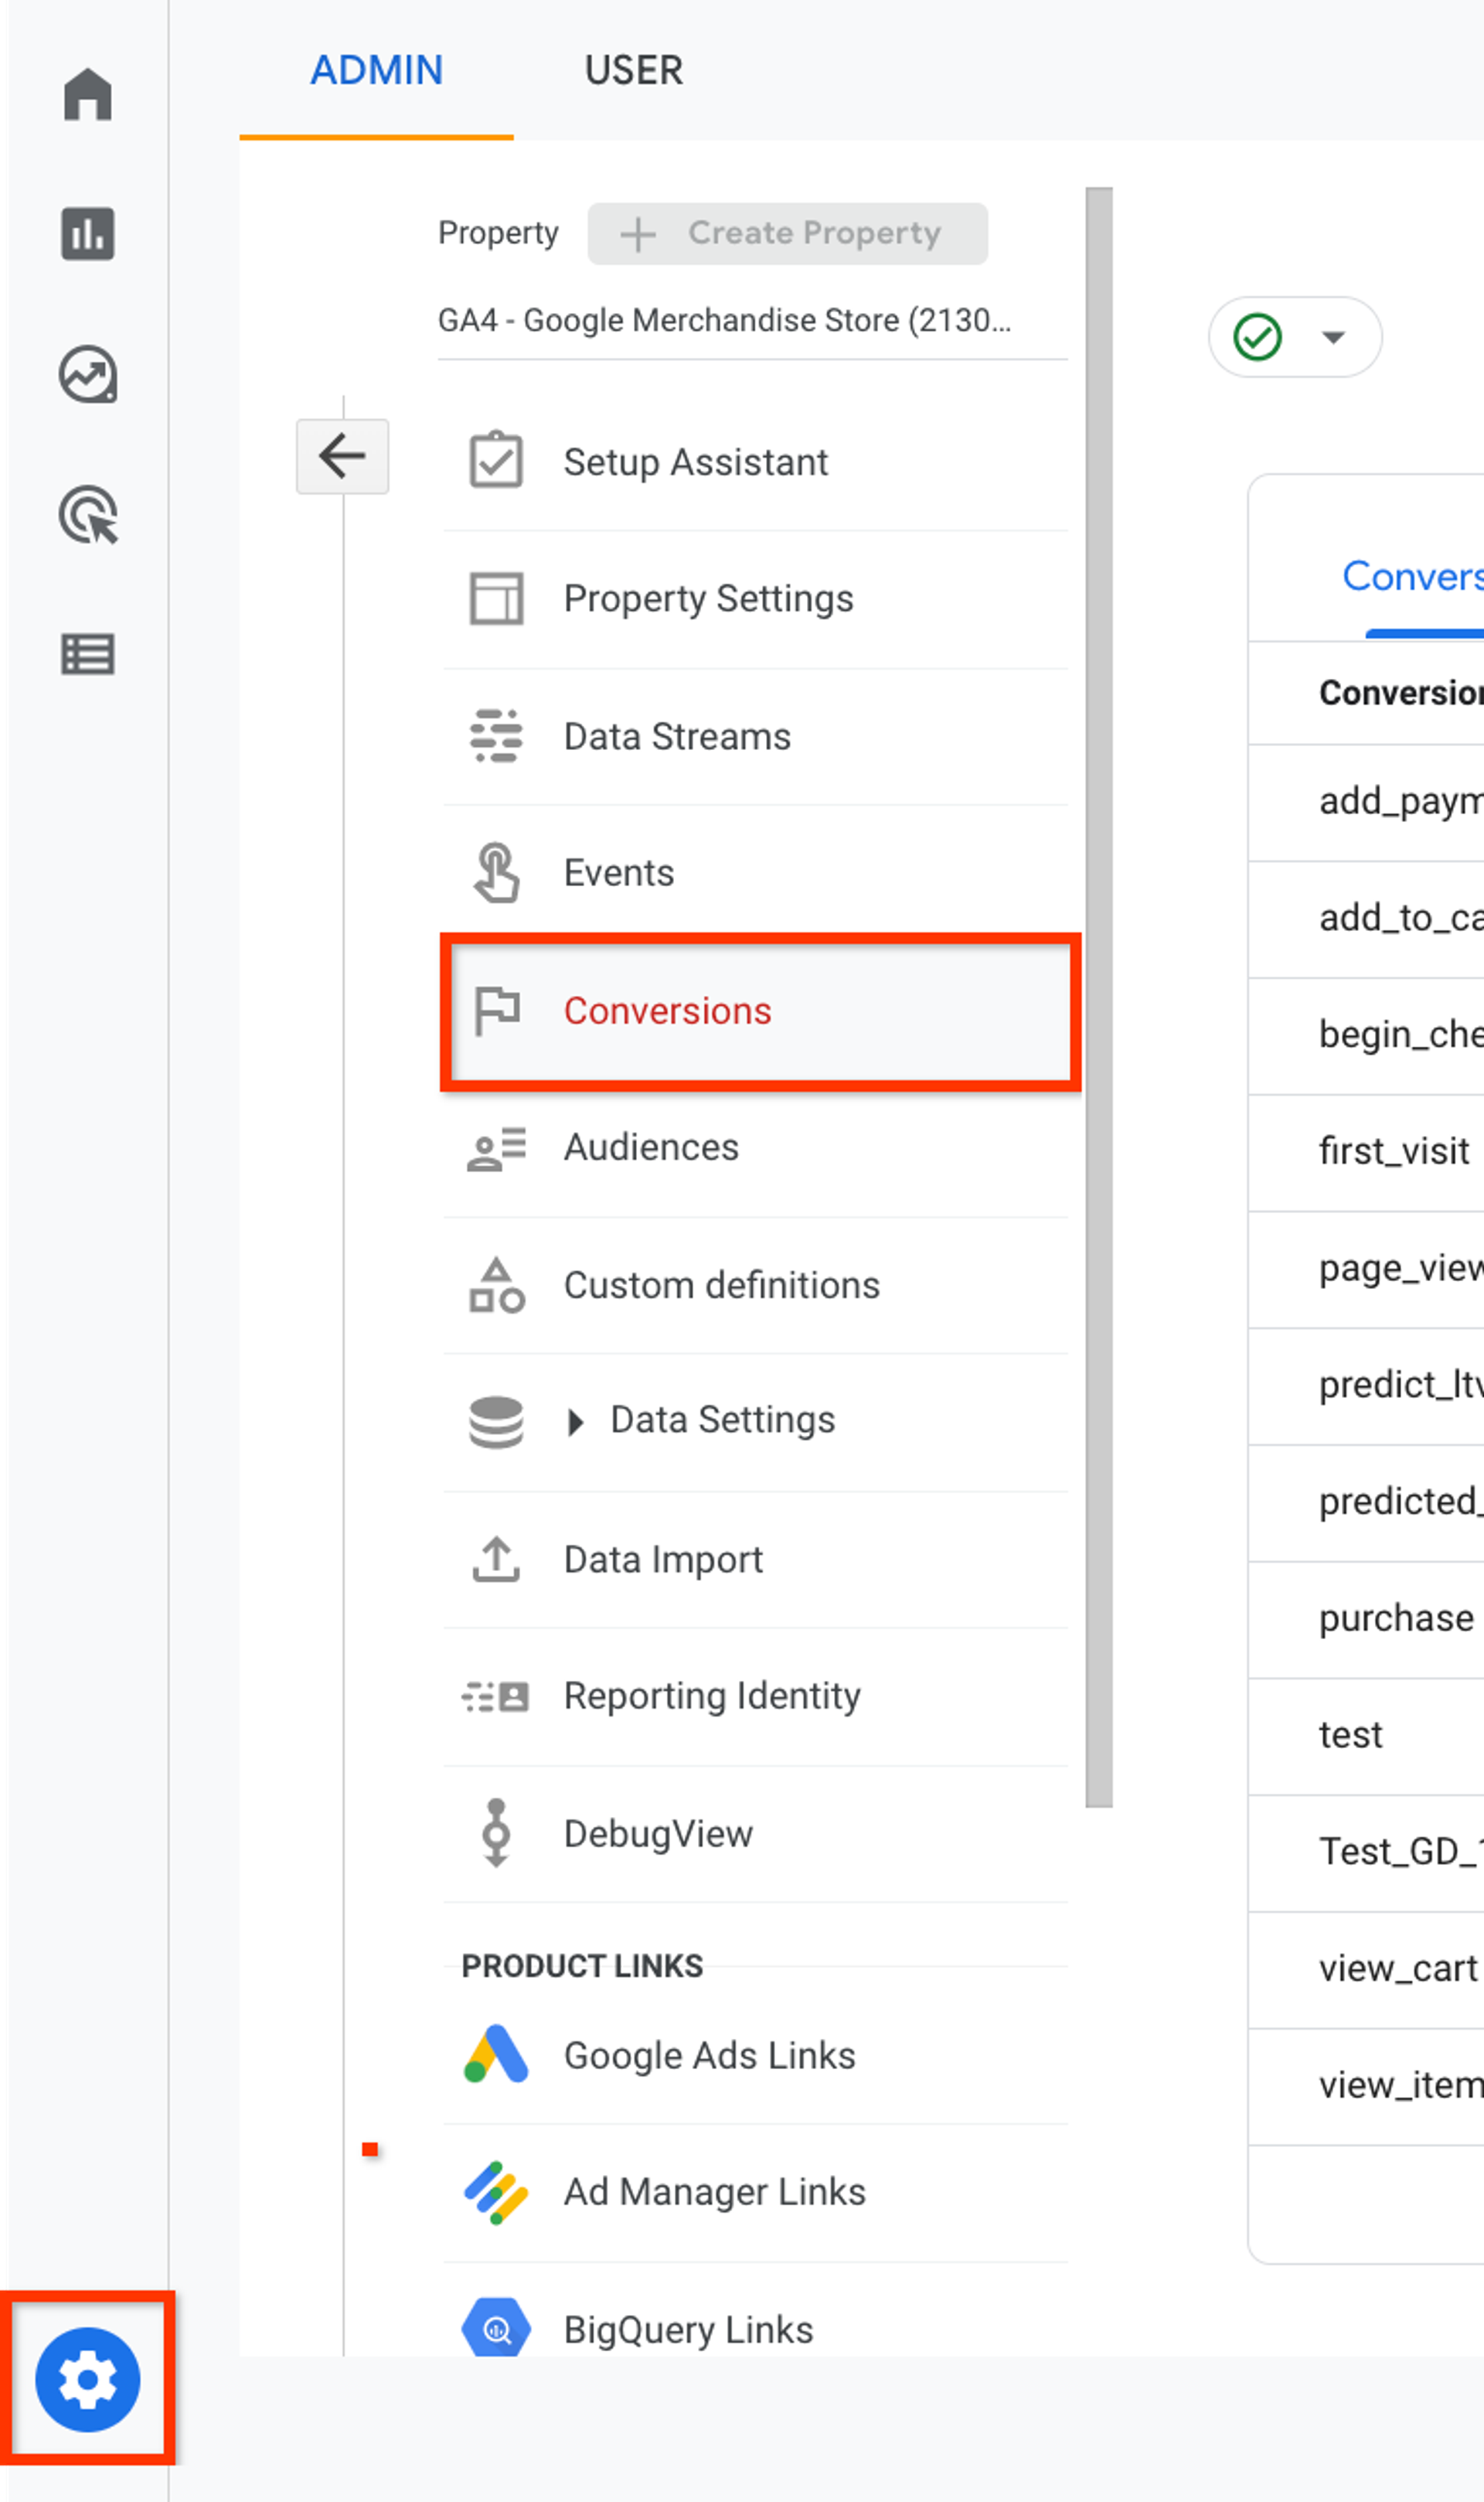
2. Hit the blue New conversion event button.
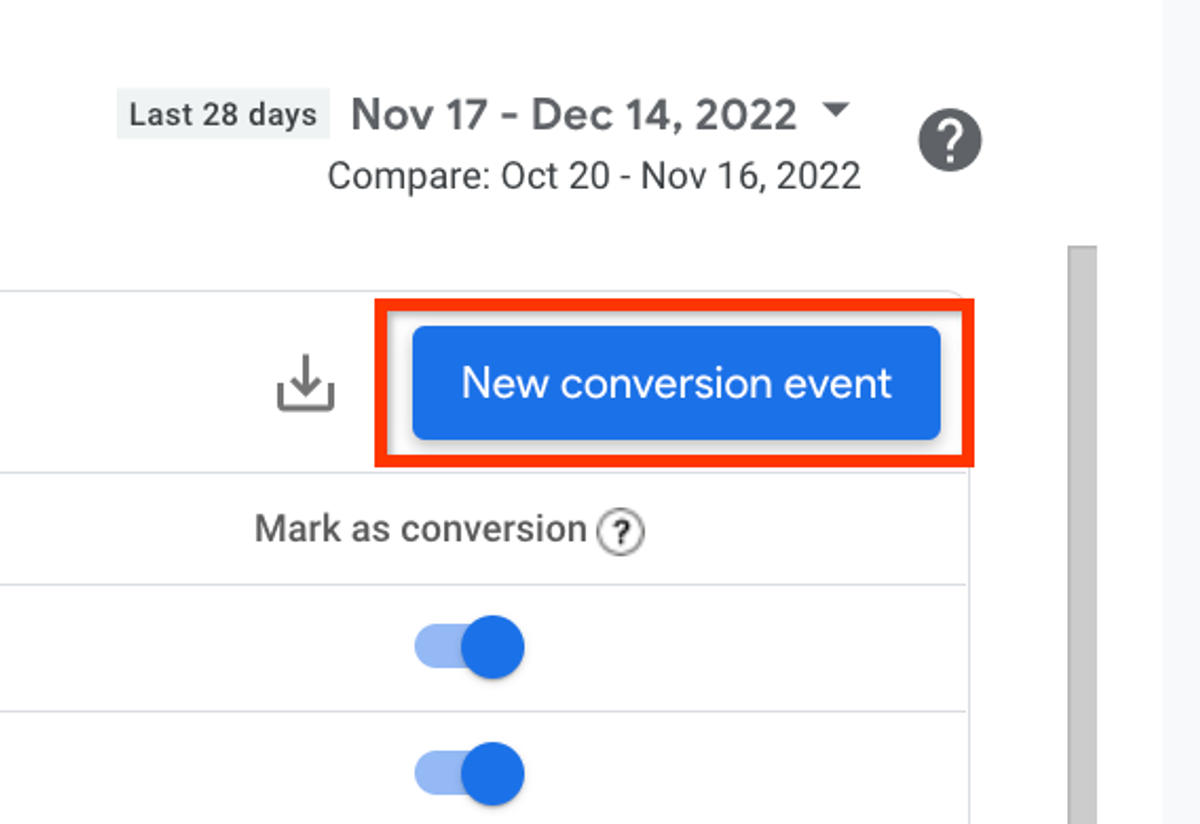
3. Enter your event name, add_to_cart.
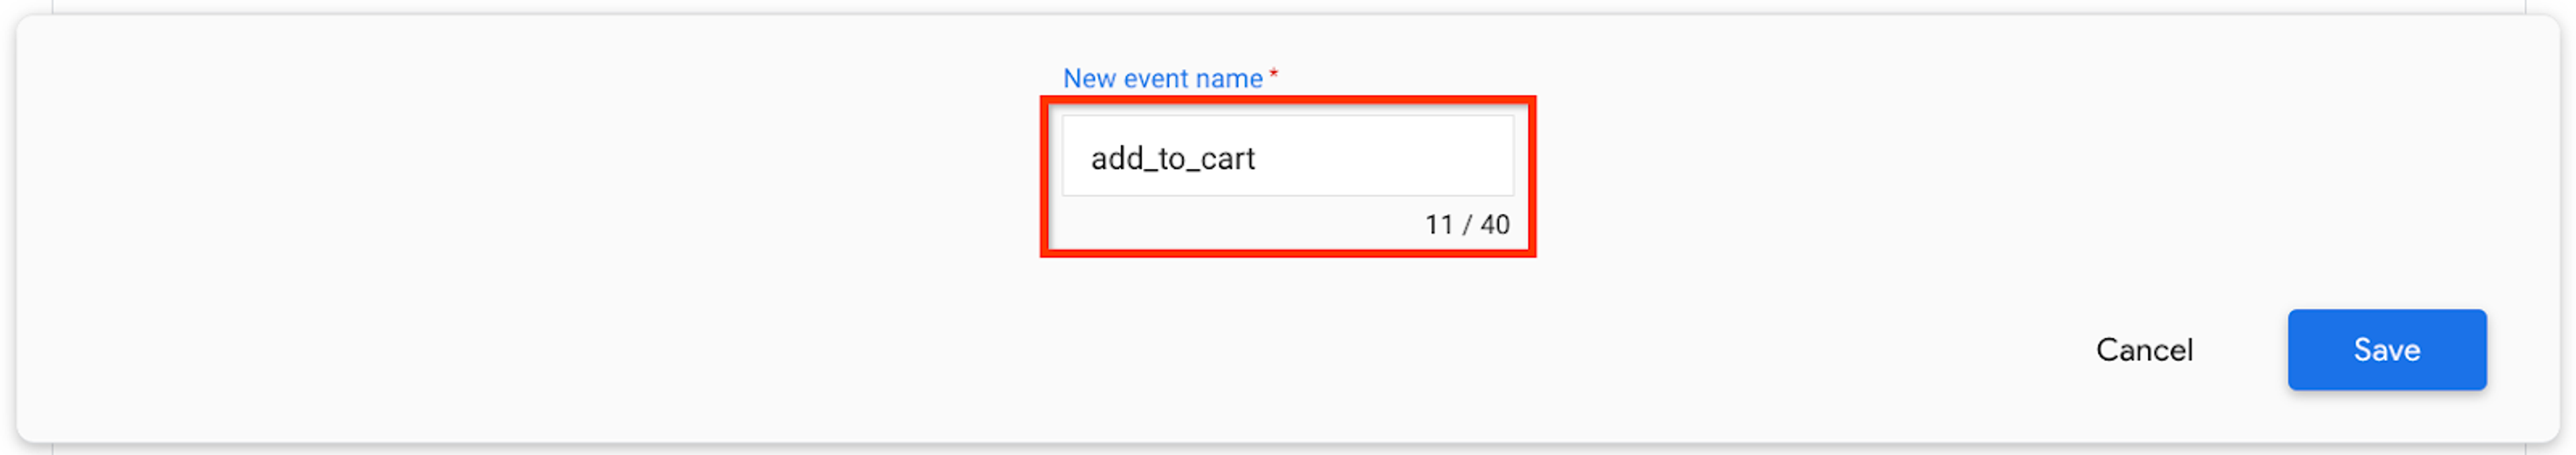
4. Hit Save.
If more than 24 hours have passed since you created the add to cart event, the required steps will be slightly different.
1. Click on Admin and select Events.
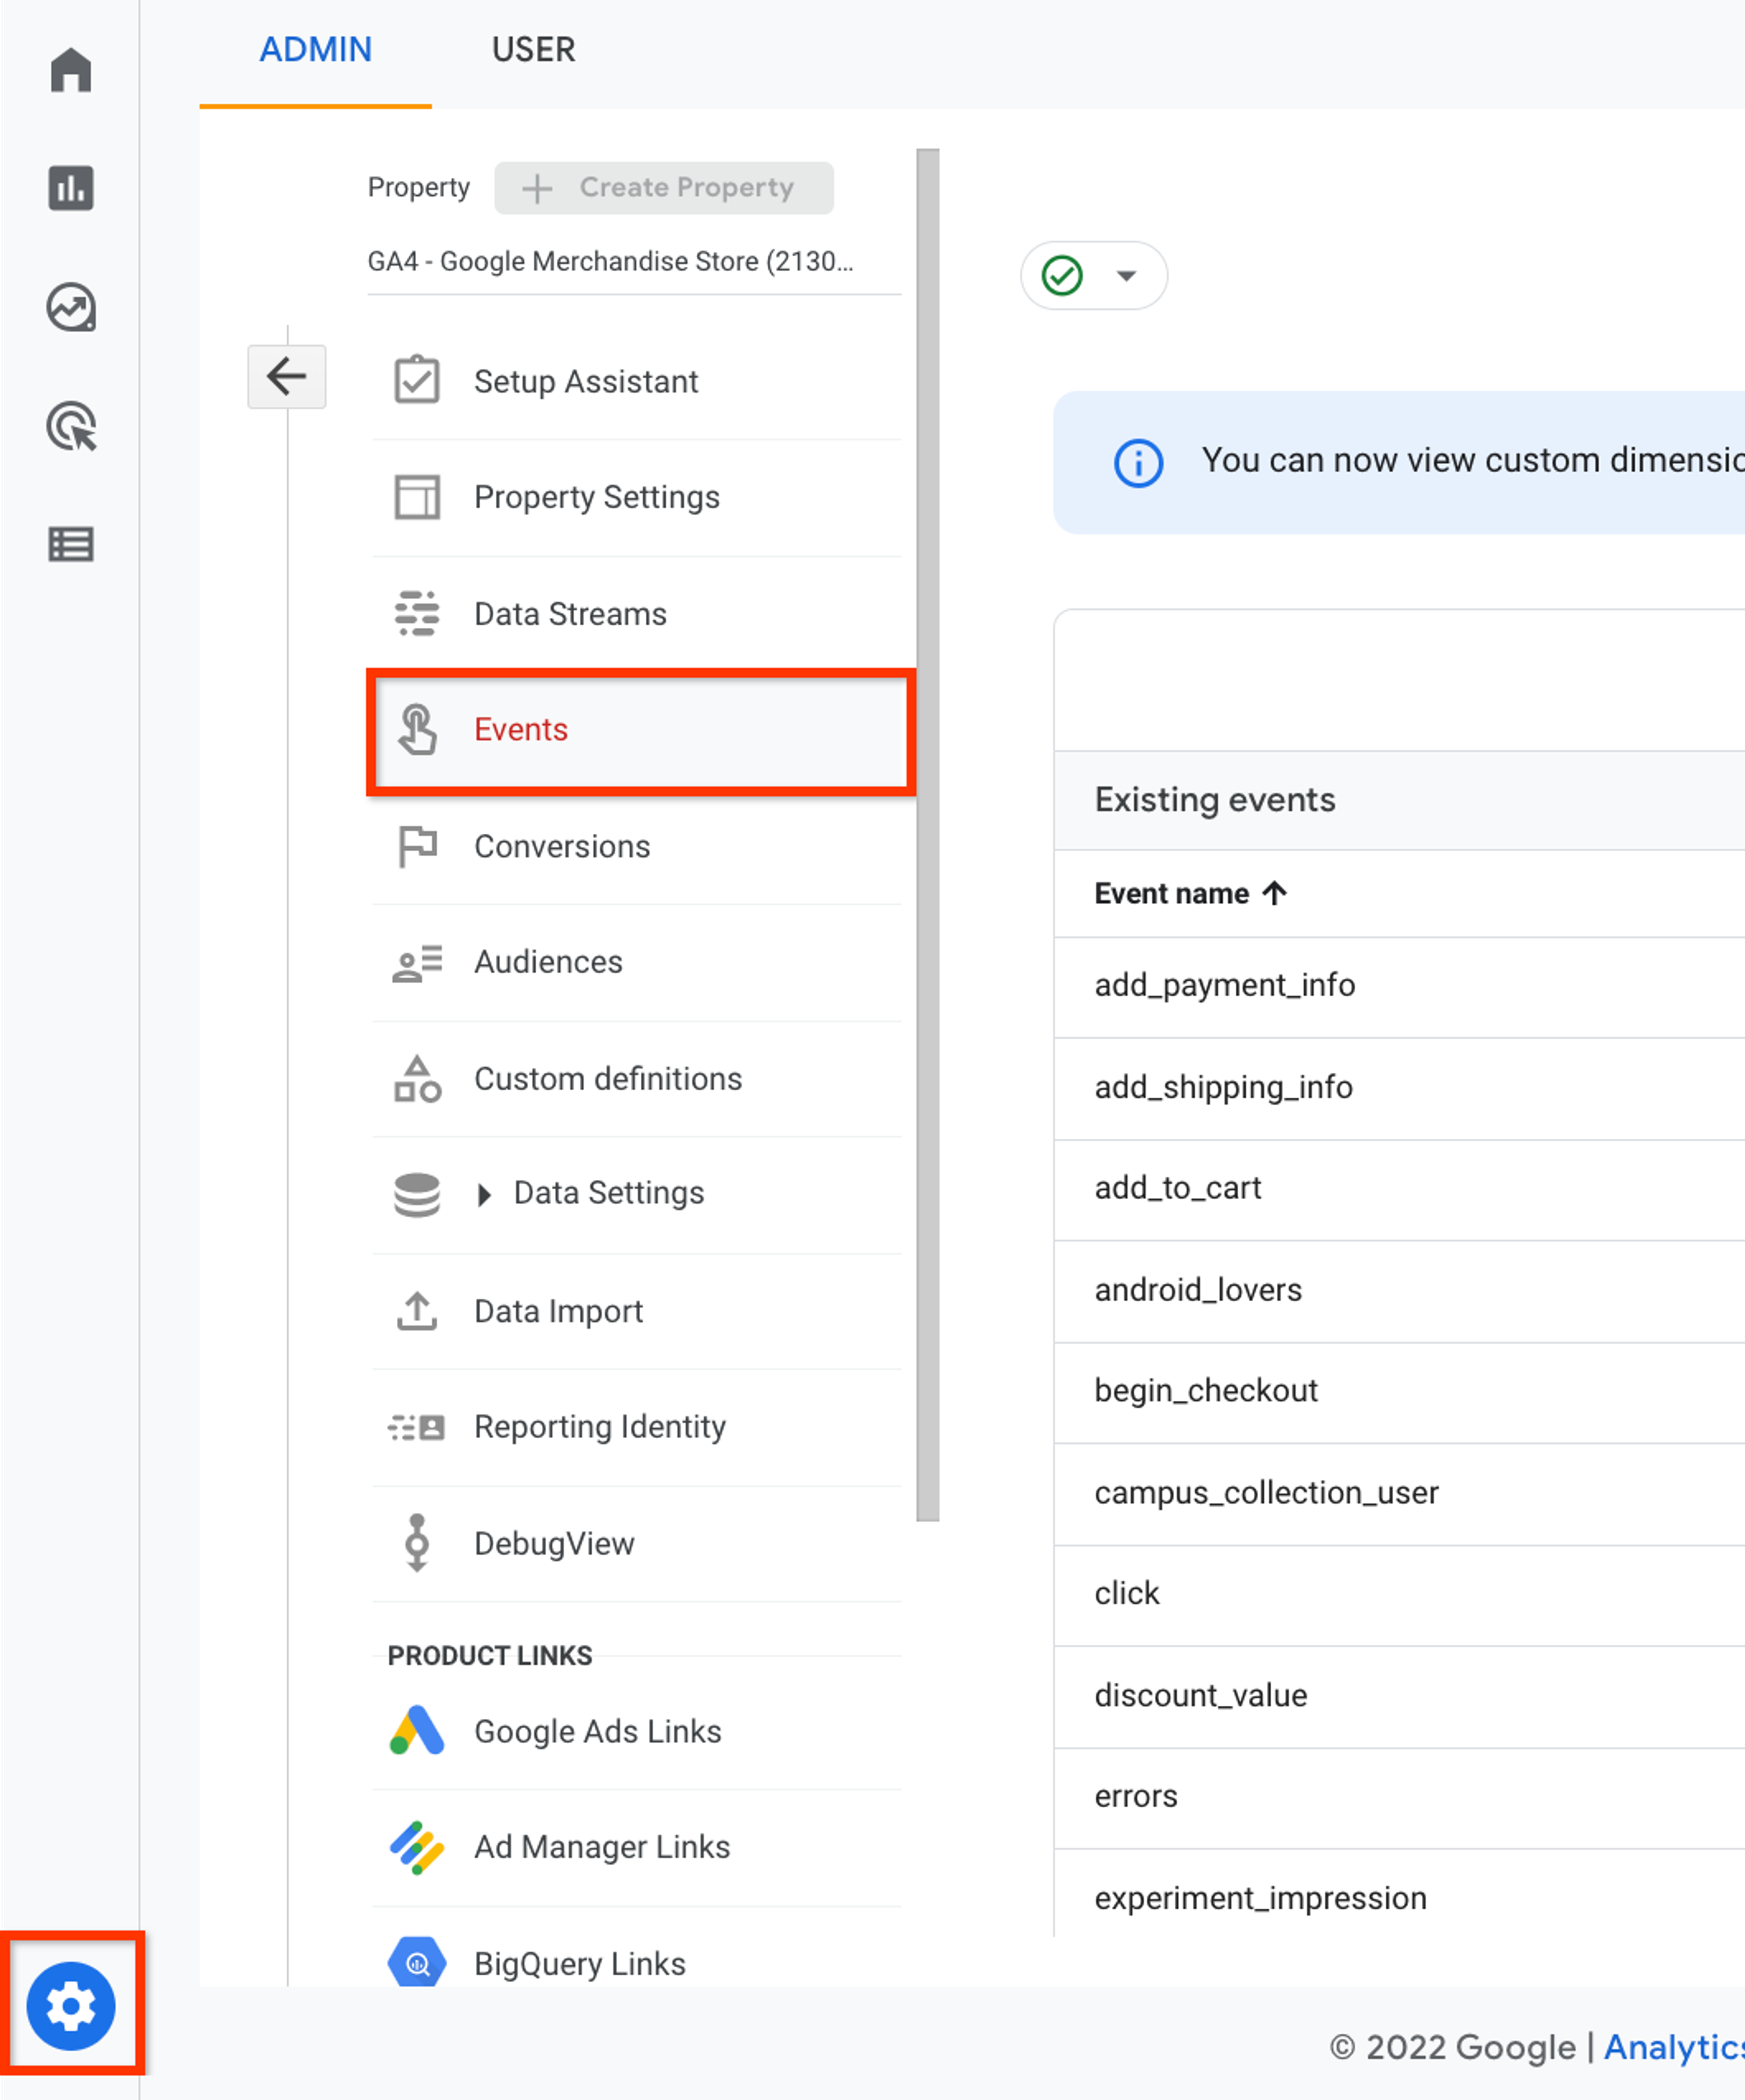
2. Under the Mark as conversion column, click on the toggle for add_to_cart.
1.9.3. Site search events
If your online store has a search bar (as it should), it is likely that this is the first thing many of your clients interact with. What they type into the search bar could give you an idea of what they are looking for on your website.
This knowledge can be used to make improvements to the user experience. If a large percentage of your visitors start their session searching for a given product, you might want to relocate it to your front page. If they often use the search bar to find products that are not there, perhaps you should look into the relevance of your ads. And if your visitors can’t find the products that are there, you probably have an even bigger problem on your hands.
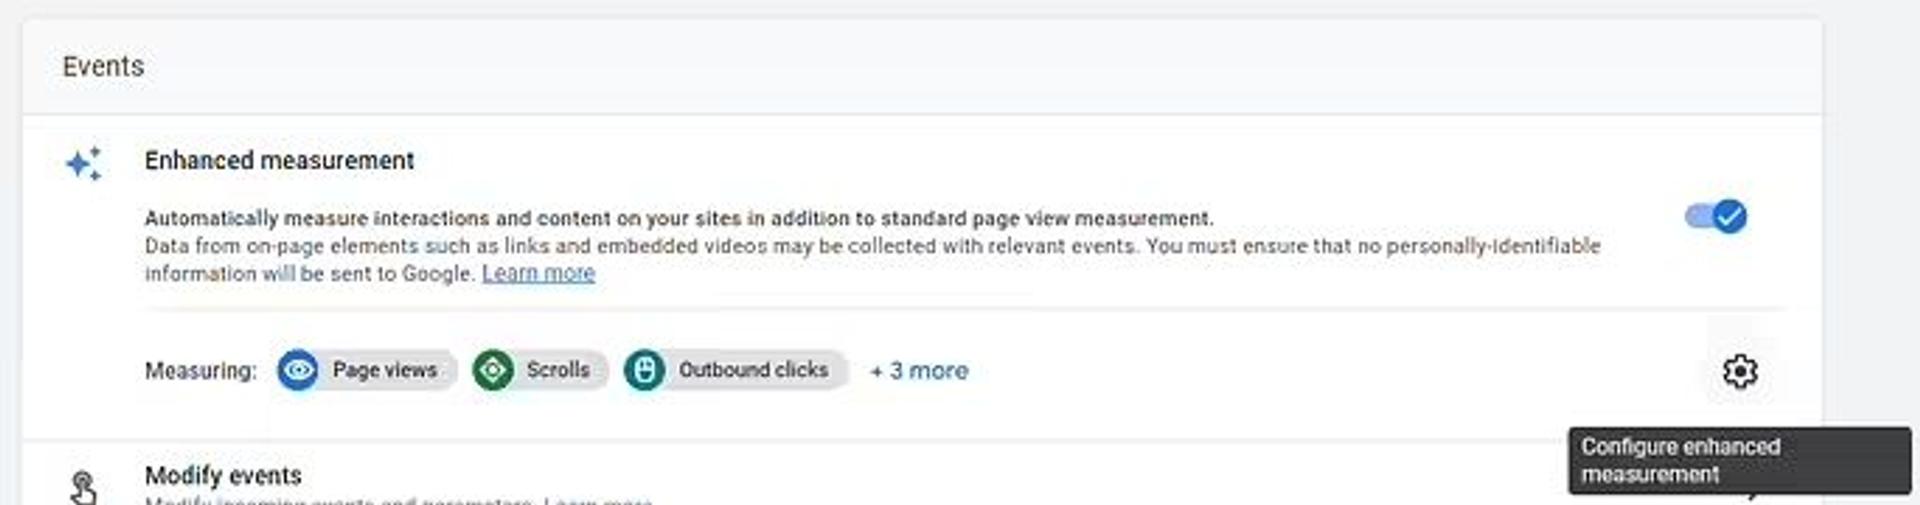
Usually, a site search event is automatically tracked by GA4, and you can turn it off in the Enhanced measurement settings if you want to implement your own custom search event.
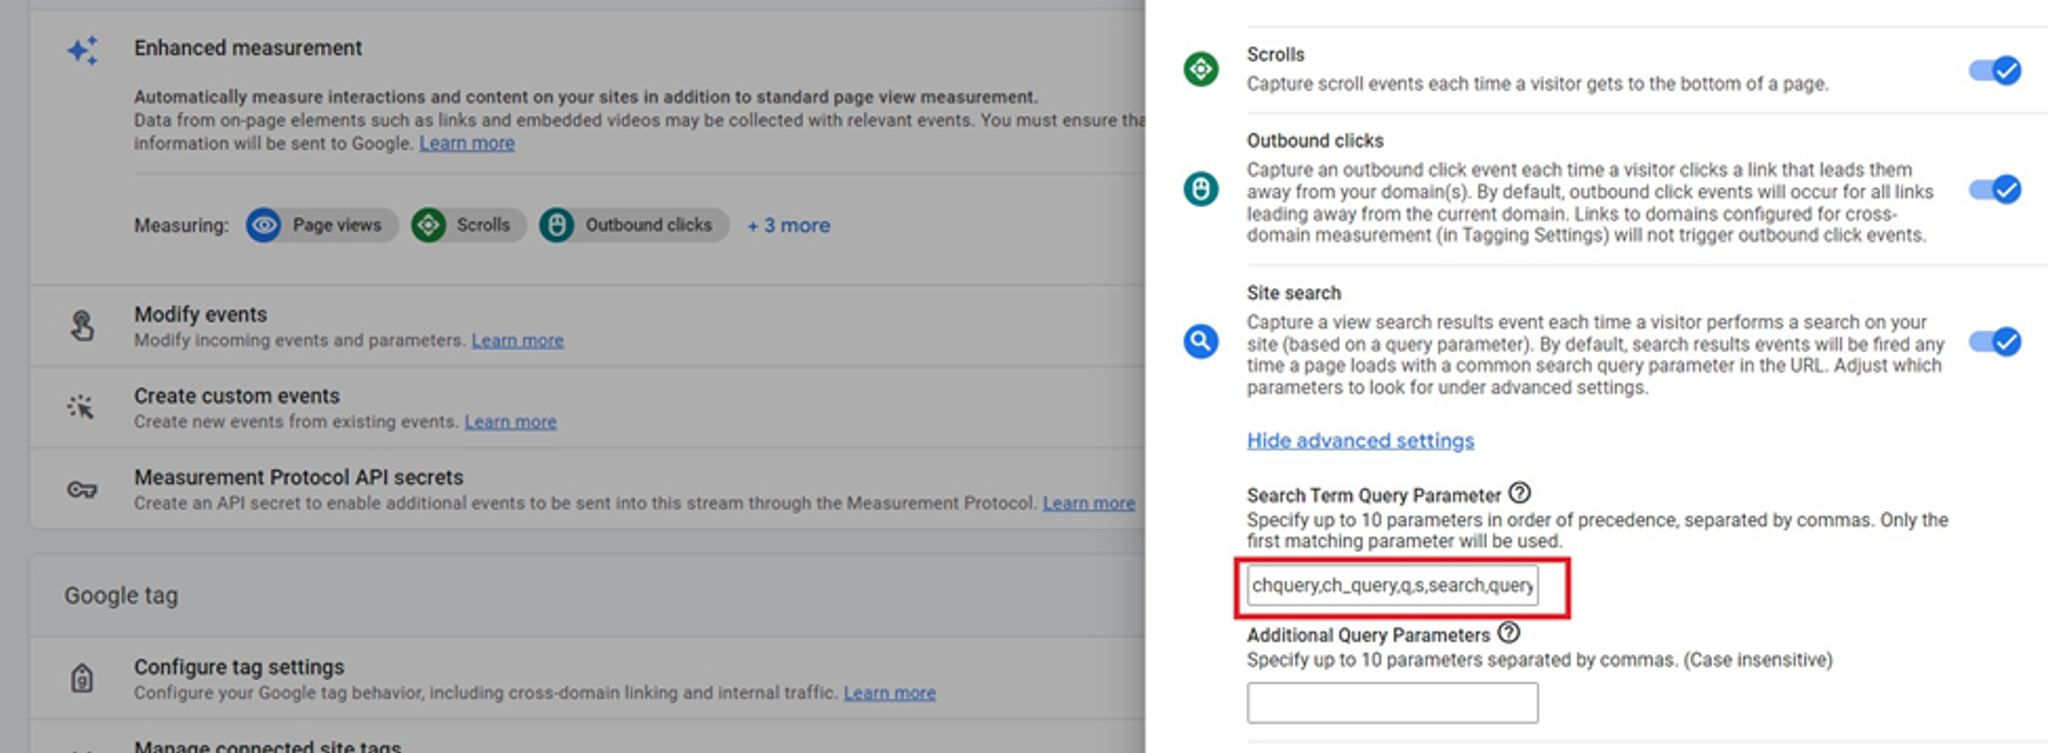
Here you can adjust your own search term queries that you have implemented on your website. Hence, the value of the Search Term parameter of the view_search_results event will take the value of this parameter.
In the case that you want to implement your own search event, you’ll need to follow these steps:
1. On the left-hand side of your Google Analytics page, select Admin.
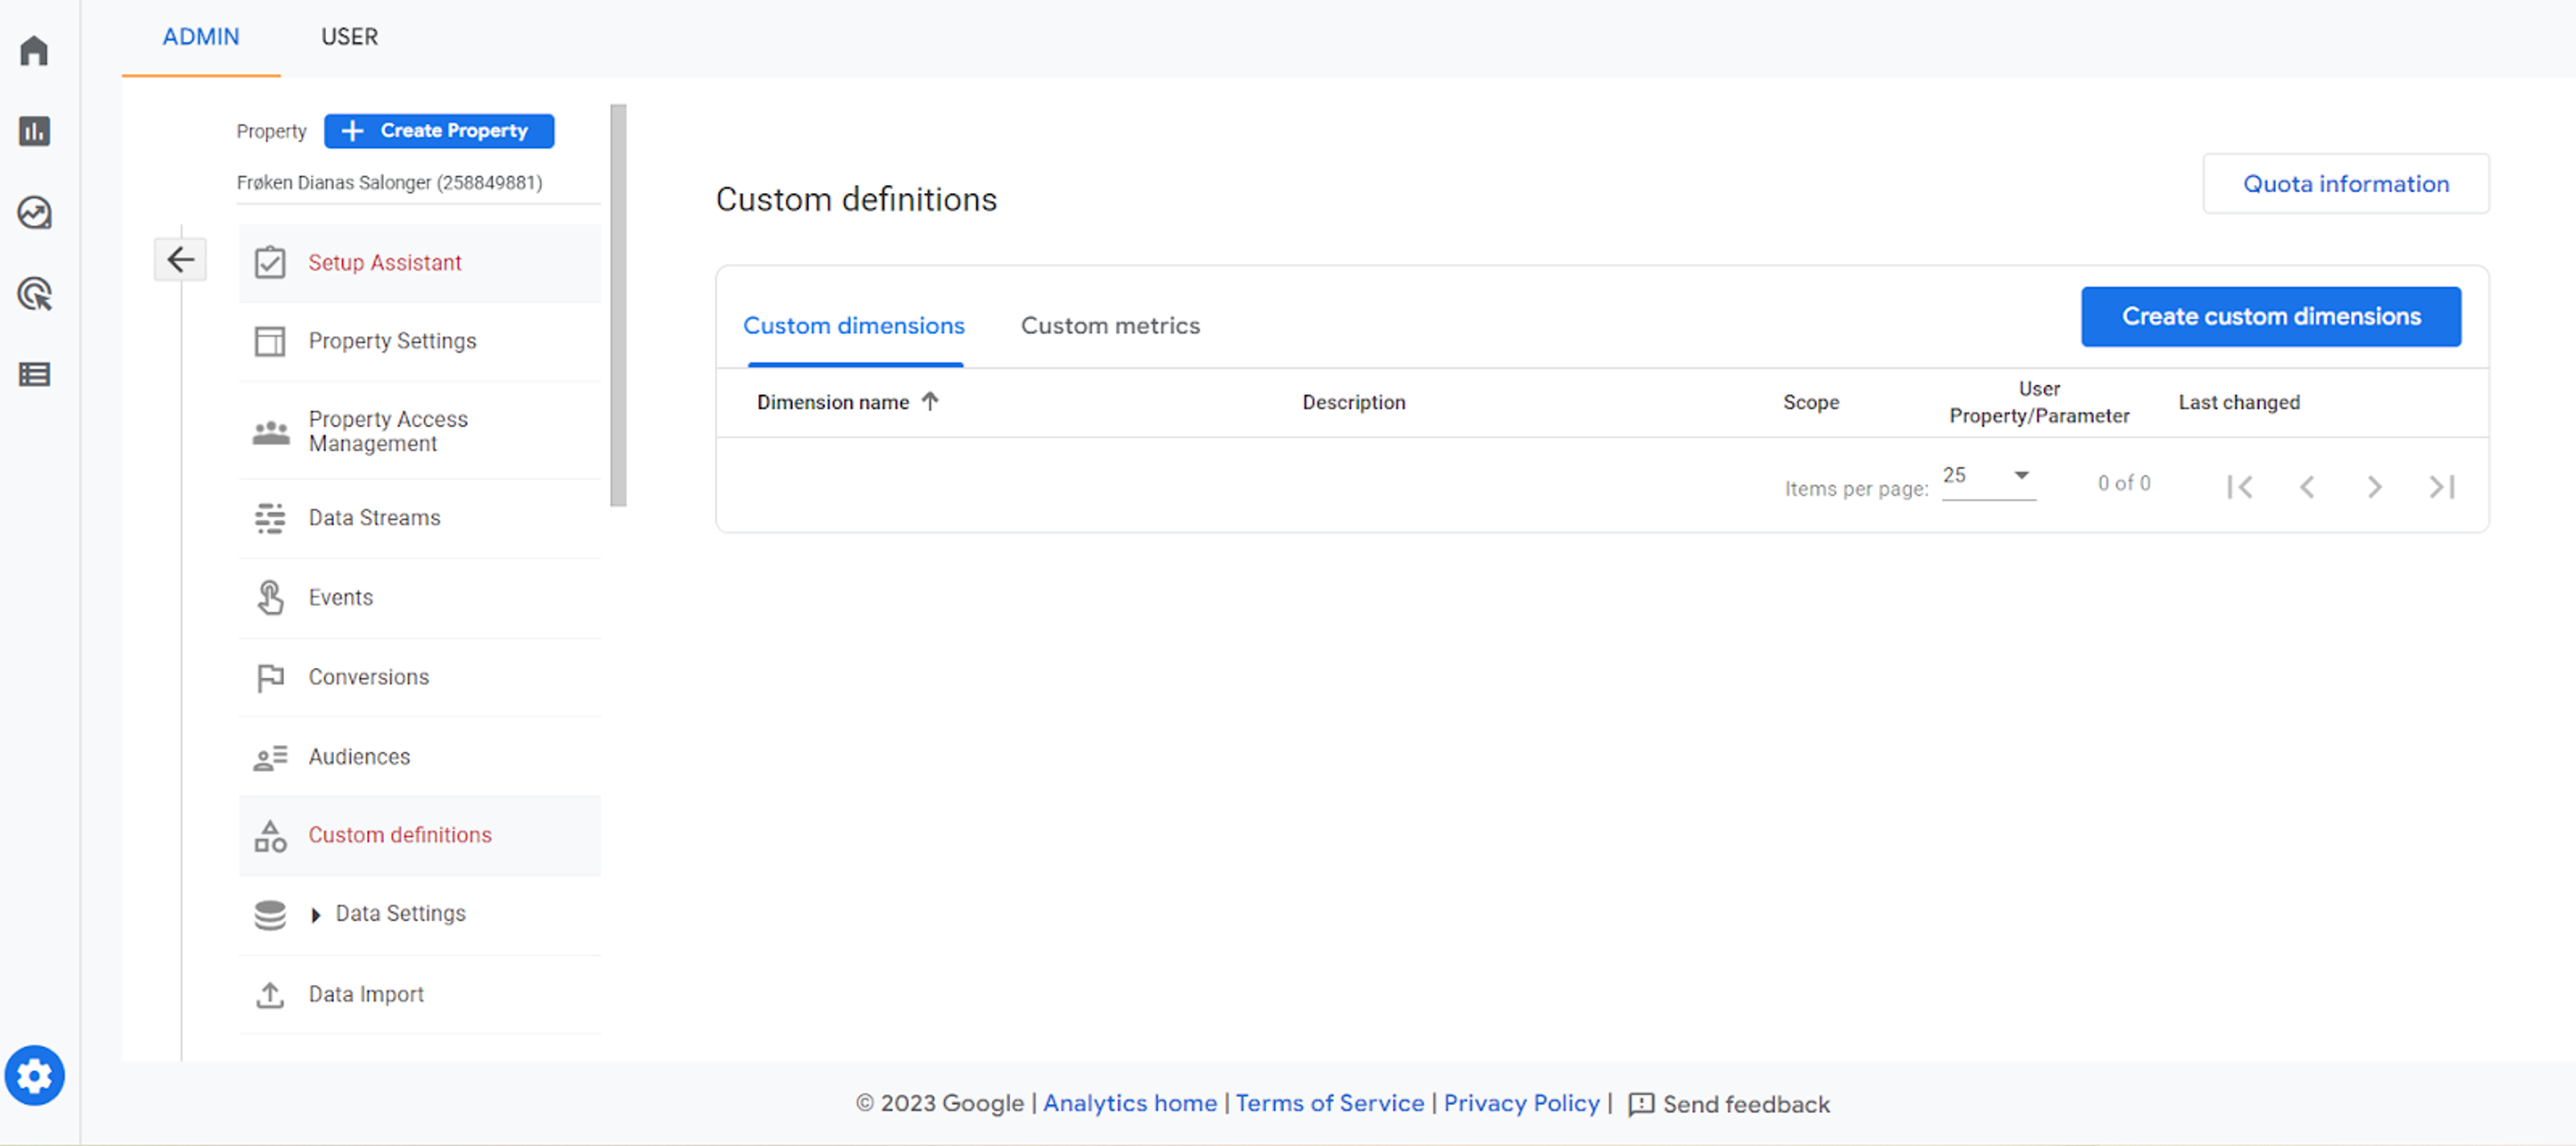
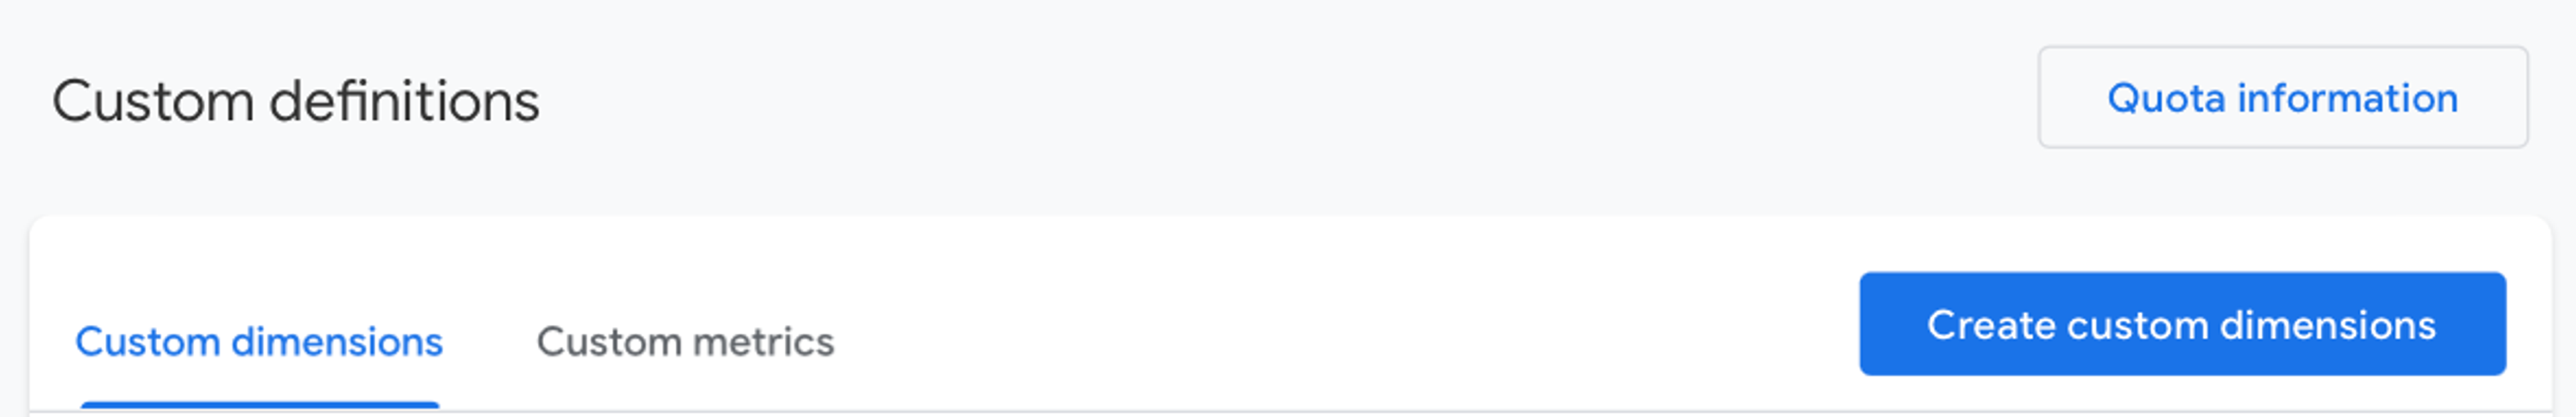
2. Click on Custom definitions.
3. Hit the blue Create custom dimension button.
4. Here, you will need to set several fields.
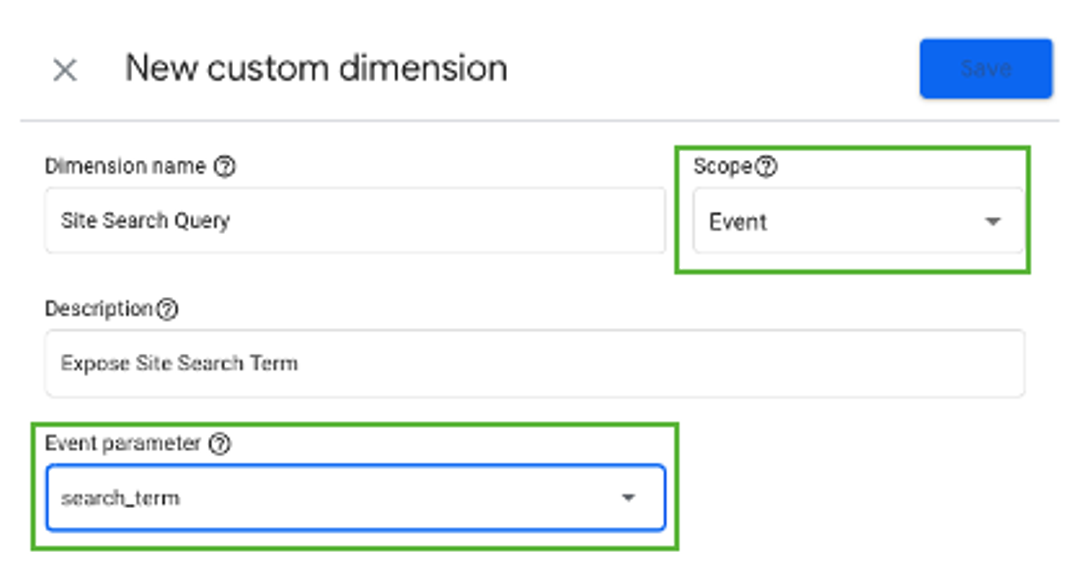
Dimension name: This is the name that will be shown in your Exploration reports. No need to be too creative here. I recommend using something simple and self-explanatory, like ‘Site Search Query’. This way, if the people managing your GA4 account change, it will be easier for them to learn the ropes.
Scope: This specifies what data your custom dimension will be applied to.
Description: Text to describe what your dimension does. Make the life of new recruits and agencies easier by telling them what they need to know.
Event parameter: This is the event parameter you want to investigate. In your case, it could be the name of your event parameter that you have configured (search_key, search_query, etc.).
5. With the above changes saved, you can find your search event with search terms in Reports - Engagement - Events by selecting view_search_results or the name of your custom event.
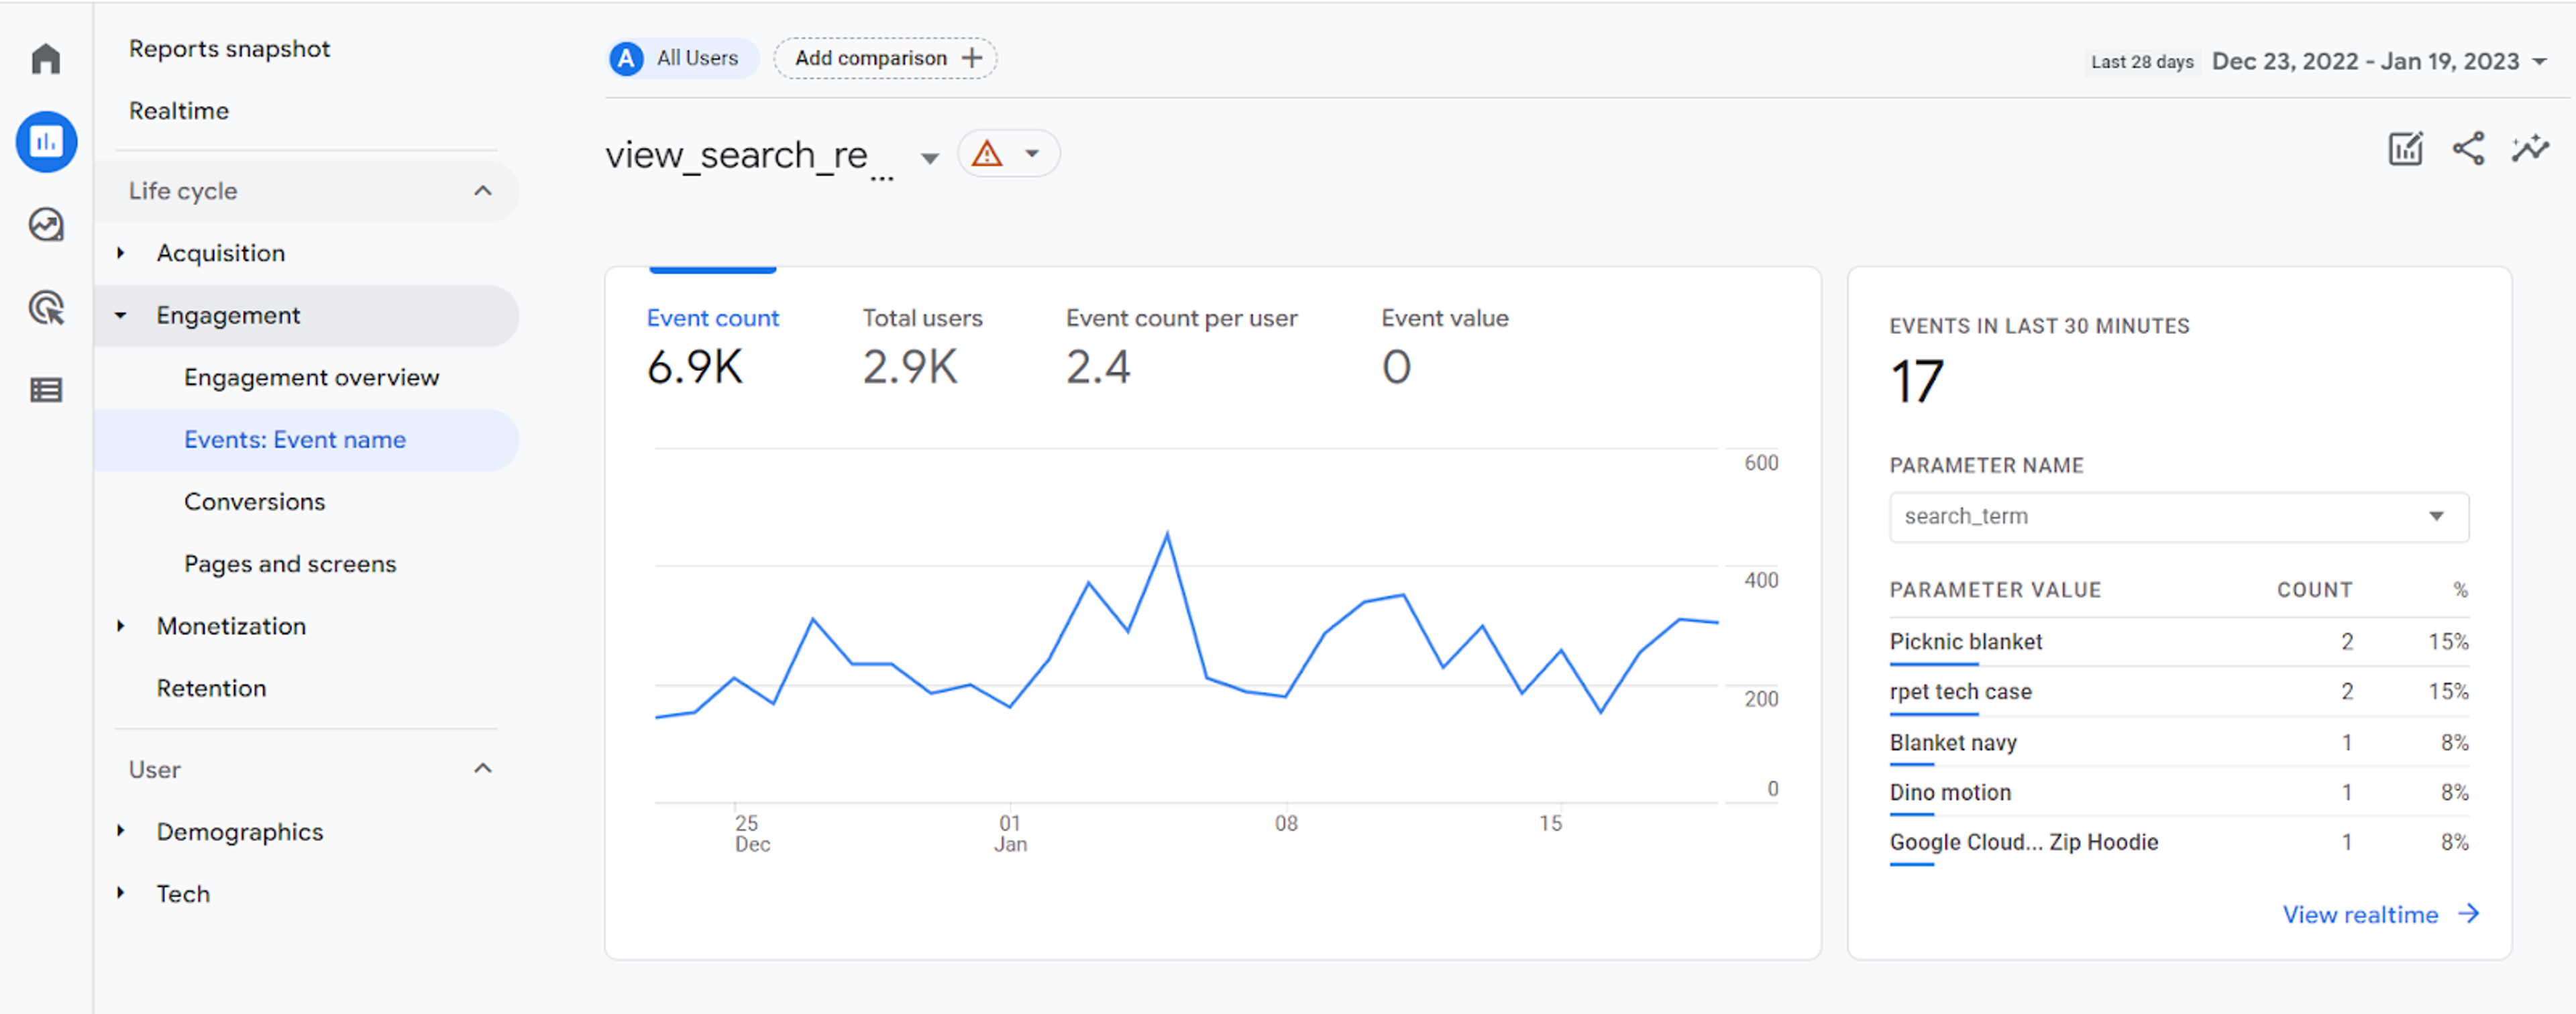
Now, you will have a list of all the terms people search for on your website. I hope you use it wisely.
Part 2: GA4 reports for CRO
2.1. Funnel exploration report
The funnel exploration report helps you track the behavior and activity of every user at each stage of the sales funnel. Since events are the subject of the report, you can see the last activity that each user engaged in before leaving your page. This report helps you determine what stage of your funnel results in the largest number of lost customers. Having identified the leak in your sales funnel, the next step is to create a plan to improve your CRO.
Since GA4 also records the devices that your customers are using, you can determine which devices yield the lowest conversion rates and track at what point the conversion is most often lost. You can then look at the user experience on that particular device. This may help you detect any issues you should fix or elements that should be modified or optimized.
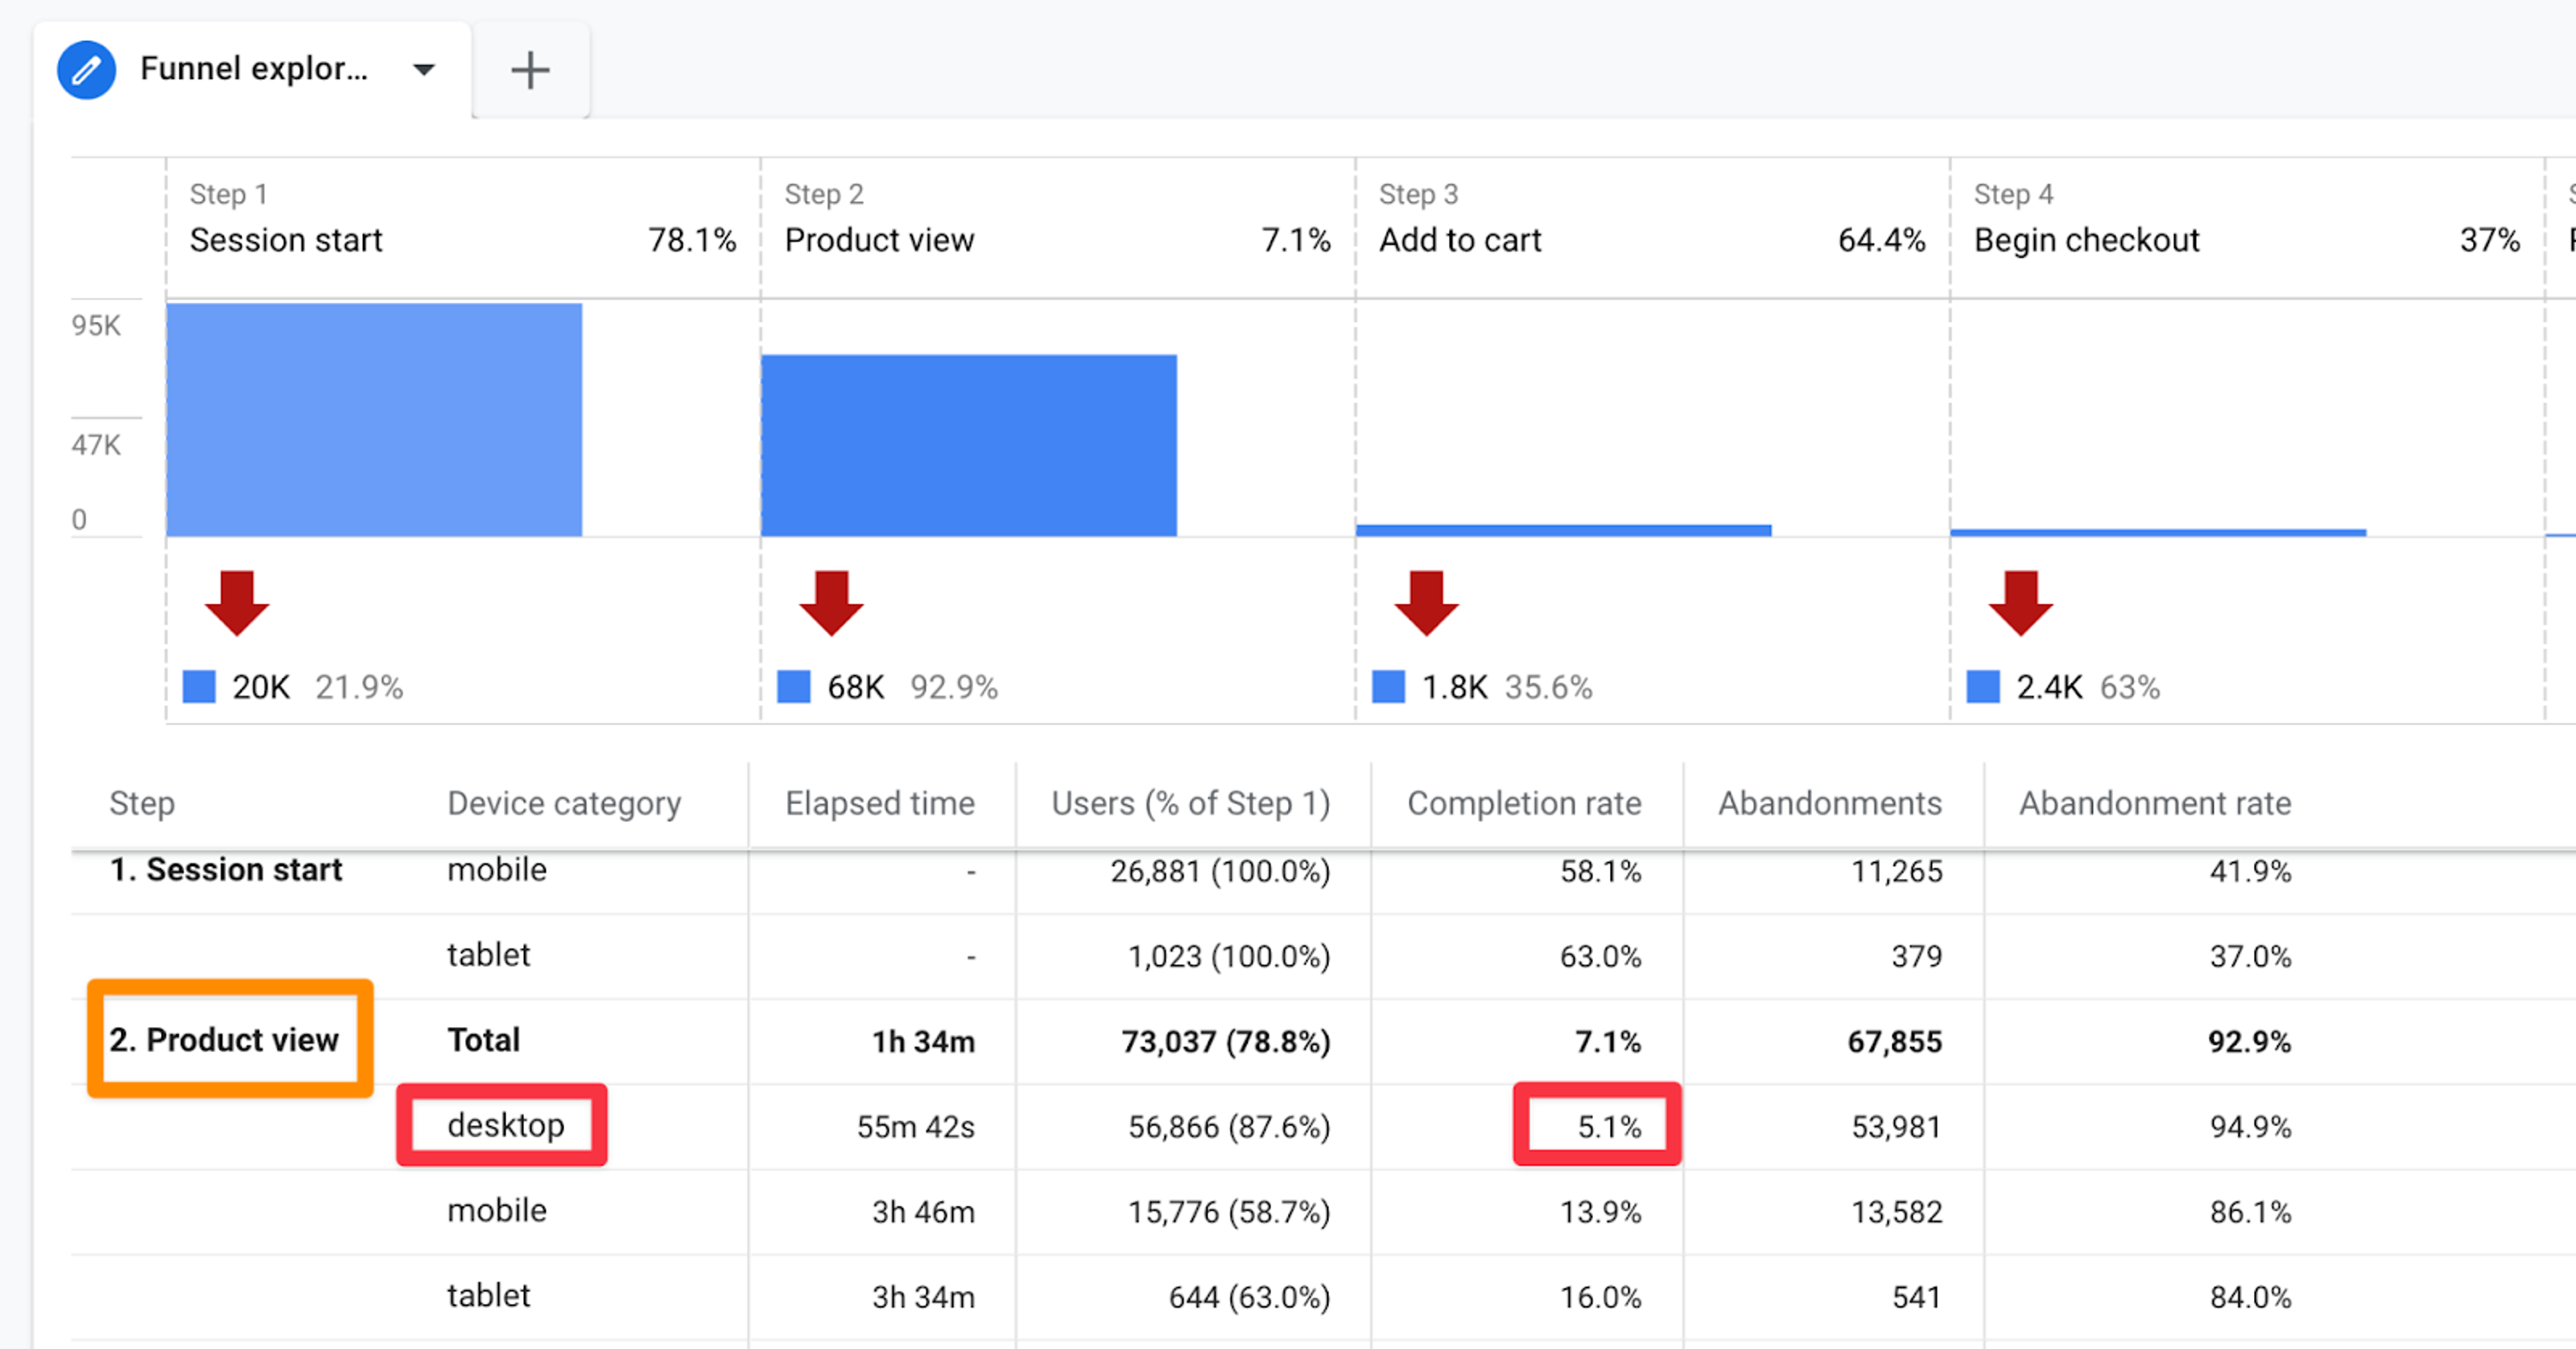
In the example shown in the above graphic, you can see that there is a very low completion rate at the product view level when analyzing desktop traffic. A very small percentage of people add products to their cart; 94.9% of your potential customers abandon the purchase. If you see something like that when analyzing your own data, I advise devising a CRO plan to address this problem and ensure that there are no technical bugs on the product pages that occur when they are accessed from the desktop.
2.2. Ecommerce purchases report
When working on products, several metrics come to play. The ecommerce purchases report identifies each metric and determines how every product has performed considering each of them. This report helps you see the best points of each product, as well as its weak points. In particular, this report can help you identify products that have the lowest add-to-cart turnovers. When you track this data, you can further analyze your products and generate strategies to optimize them.
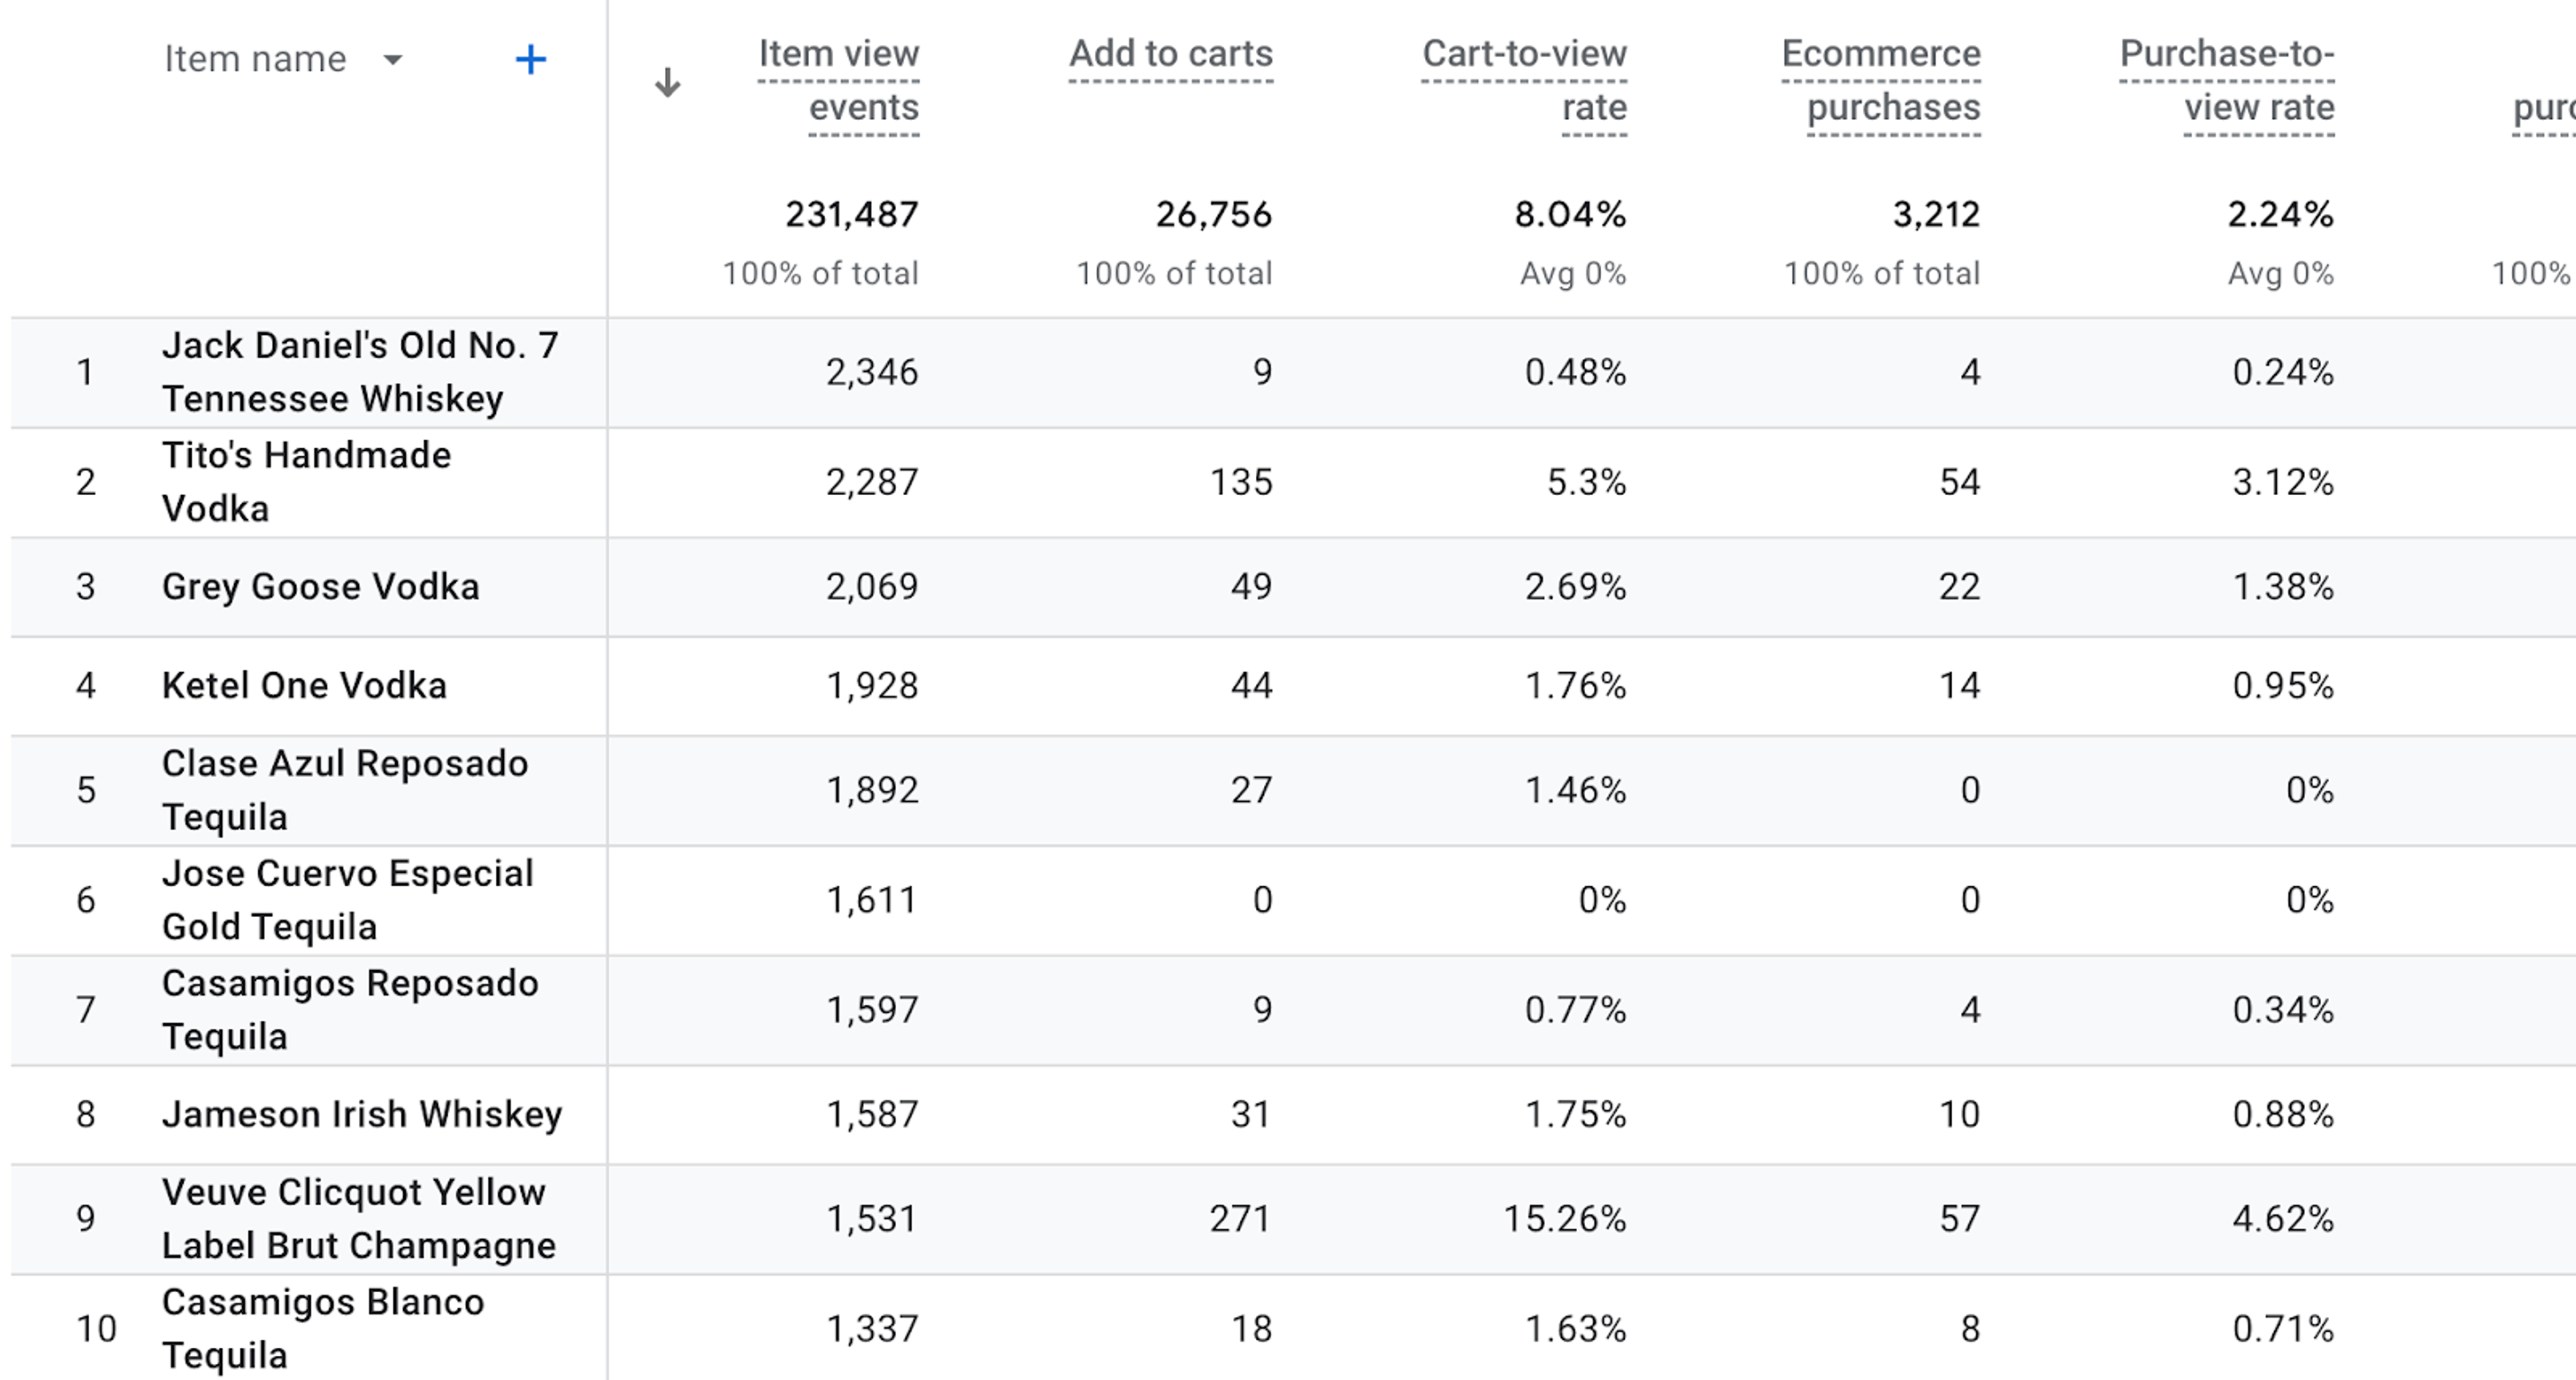
You can also spot the products that are raking in the most revenue. This helps you allocate your ad spend focusing on these products while you work on optimizing the underperforming ones.
In the example shown in the image above , you can see that, when ranking the products by the number of item views, the top 8 items have a very low cart-to-view ratio. This means that relatively few people add those products to their cart after viewing them. In this case, I would suggest driving less traffic to these product pages from your paid ads while you investigate this problem.
2.3. Source/medium report
The source refers to the websites that have directed users to your products. When you have multiple sources, this report helps you understand what links or sources are drawing the most people to your website, and who these people are. Not all sites are equally influential, and it is best to target websites with the biggest impact. This report helps you see how well your products are doing on the most influential sites and retarget them accordingly.
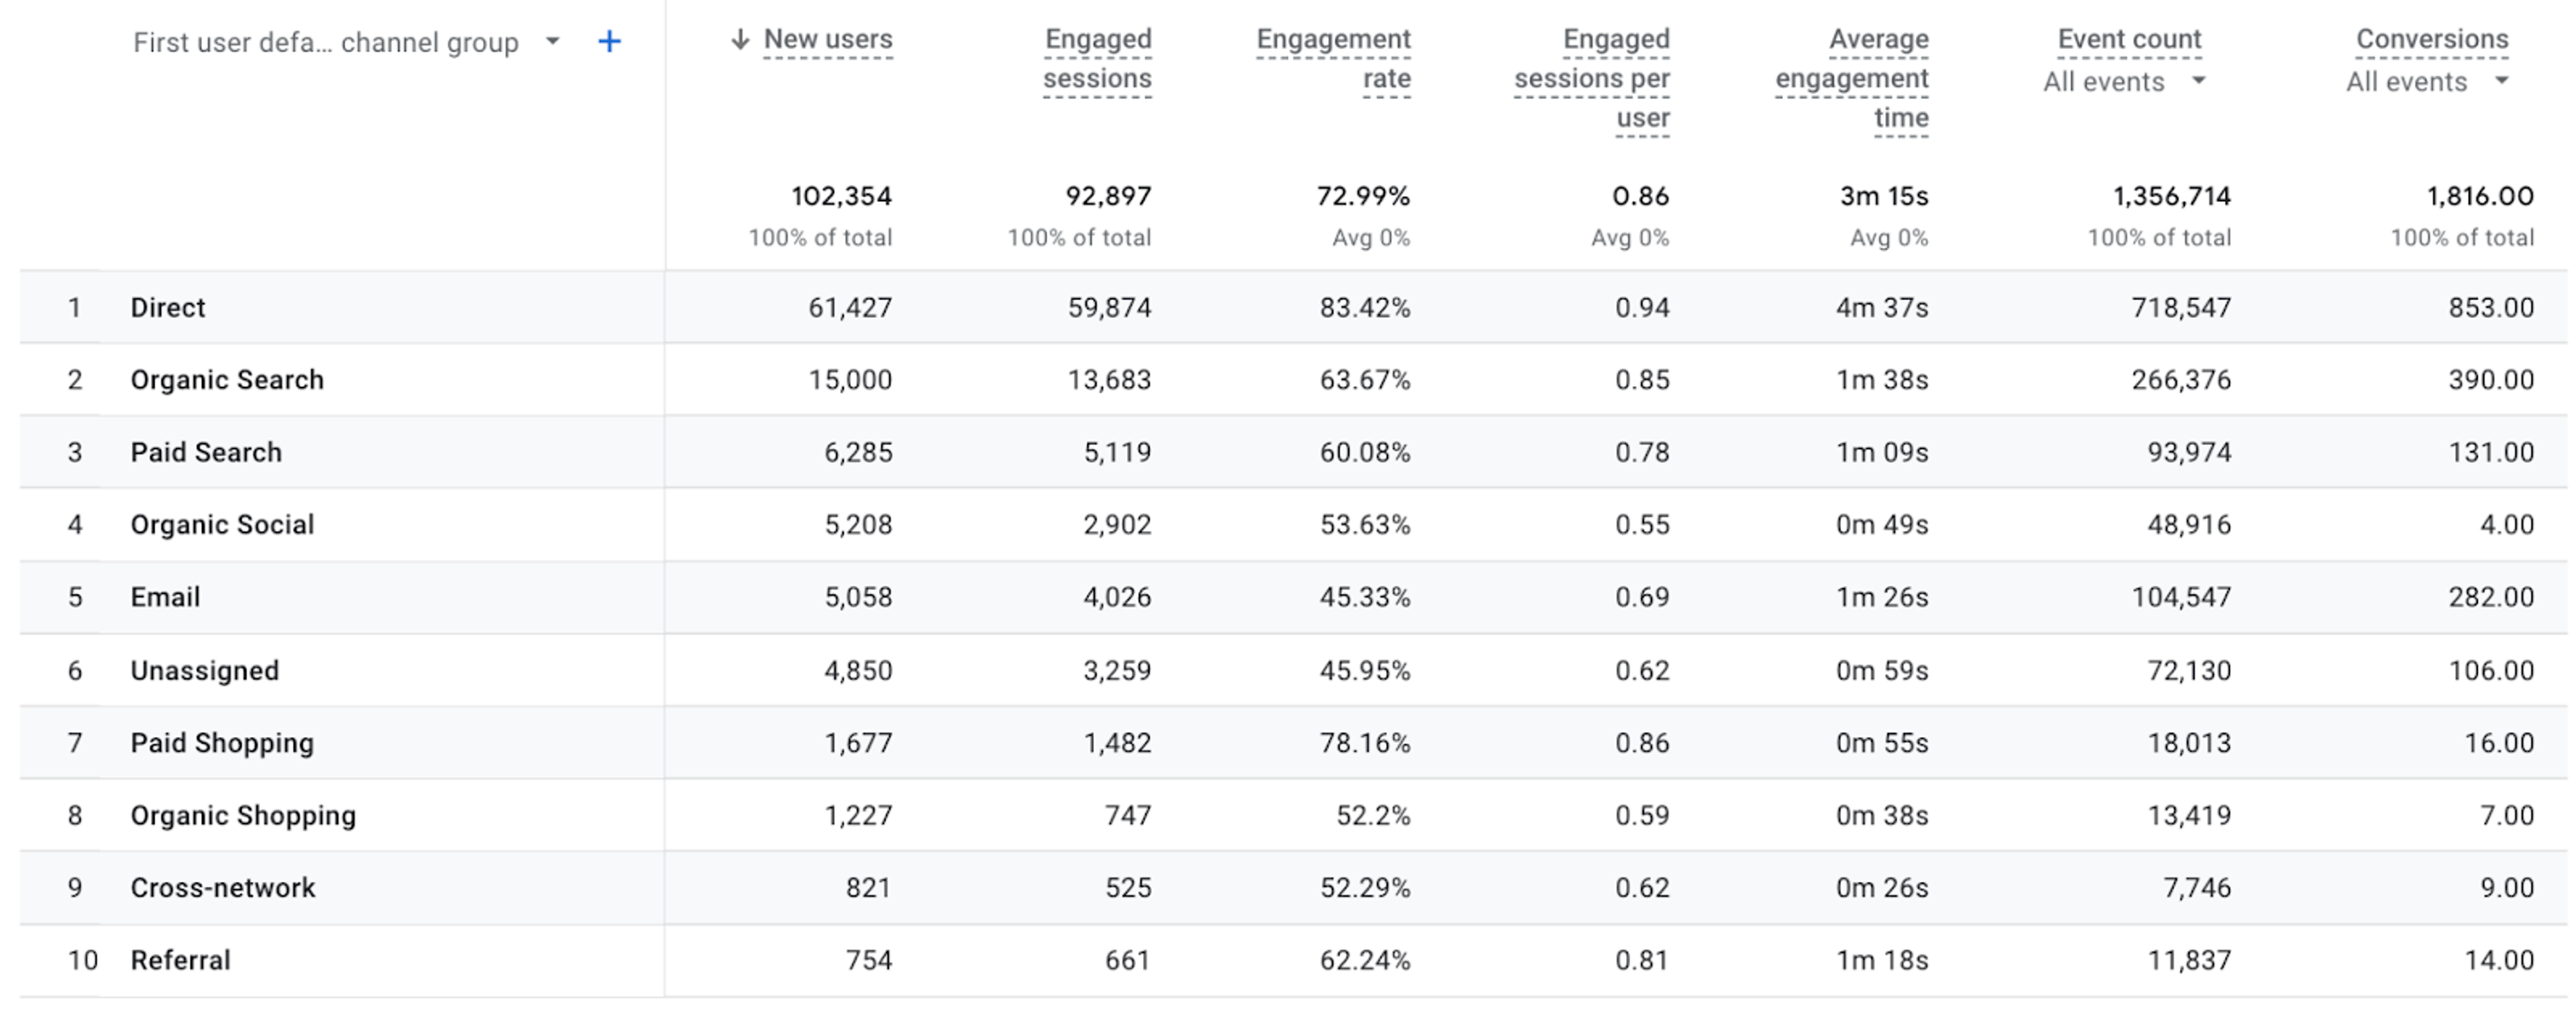
In the example above, you can see that there is a very low conversion rate from Google CPC and attentive/text. This gives a clear indication that you should start looking into Google Ads and try to find ways to optimize your campaigns there.
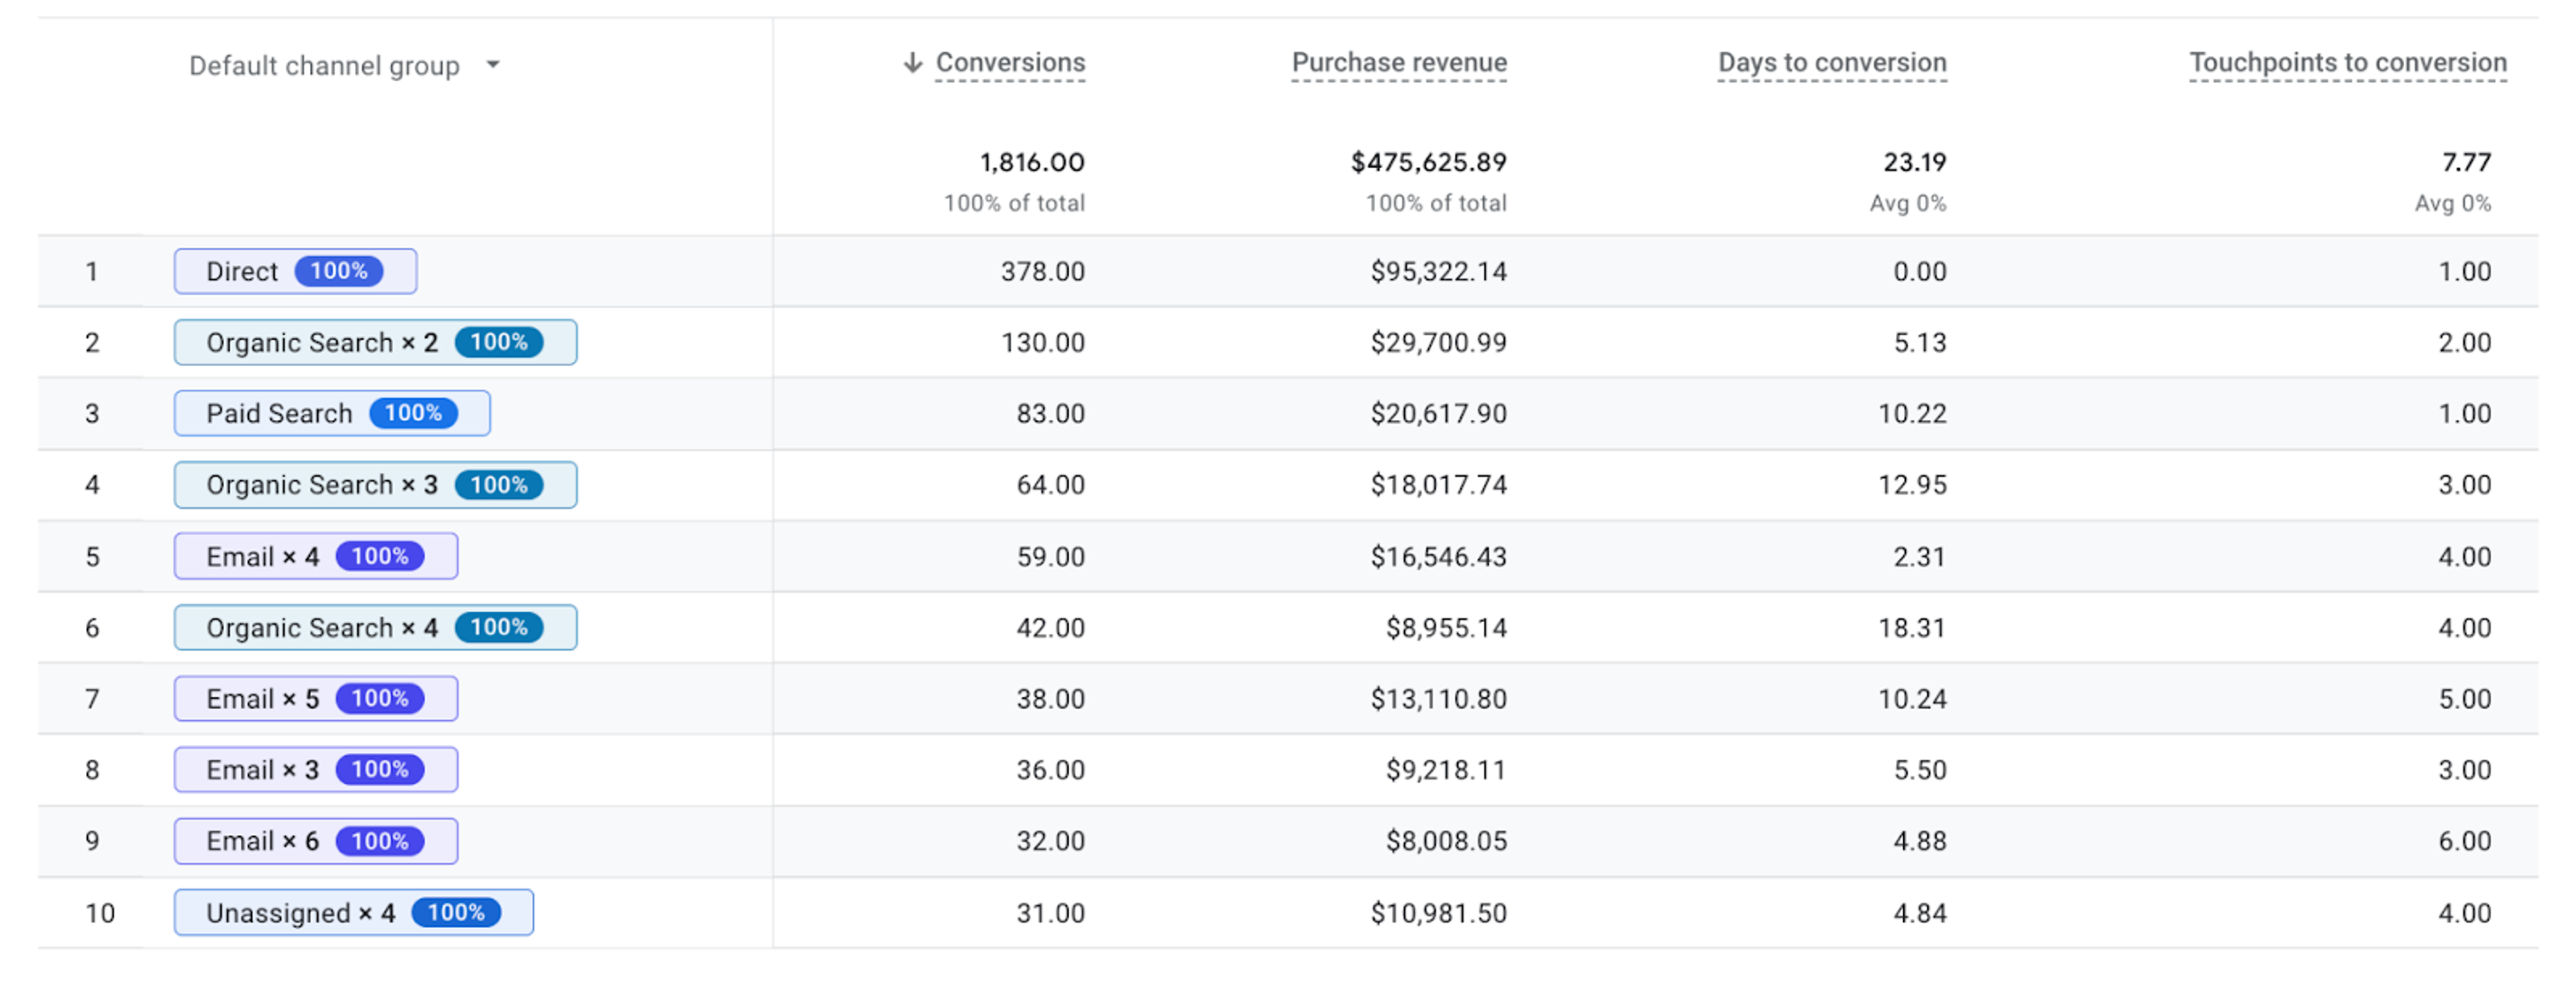
2.4. Conversion path report
The Conversion paths report gives you a breakdown of all the paths through which users complete the conversion. From the top row, you can see all the conversion paths you selected and how each one has performed. The report is usually arranged in descending order, showing which paths have the highest conversions. You can also order the conversion paths by revenue. The Conversion path report helps you track an omnichannel user journey to understand what paths on the channel are delivering the best results.
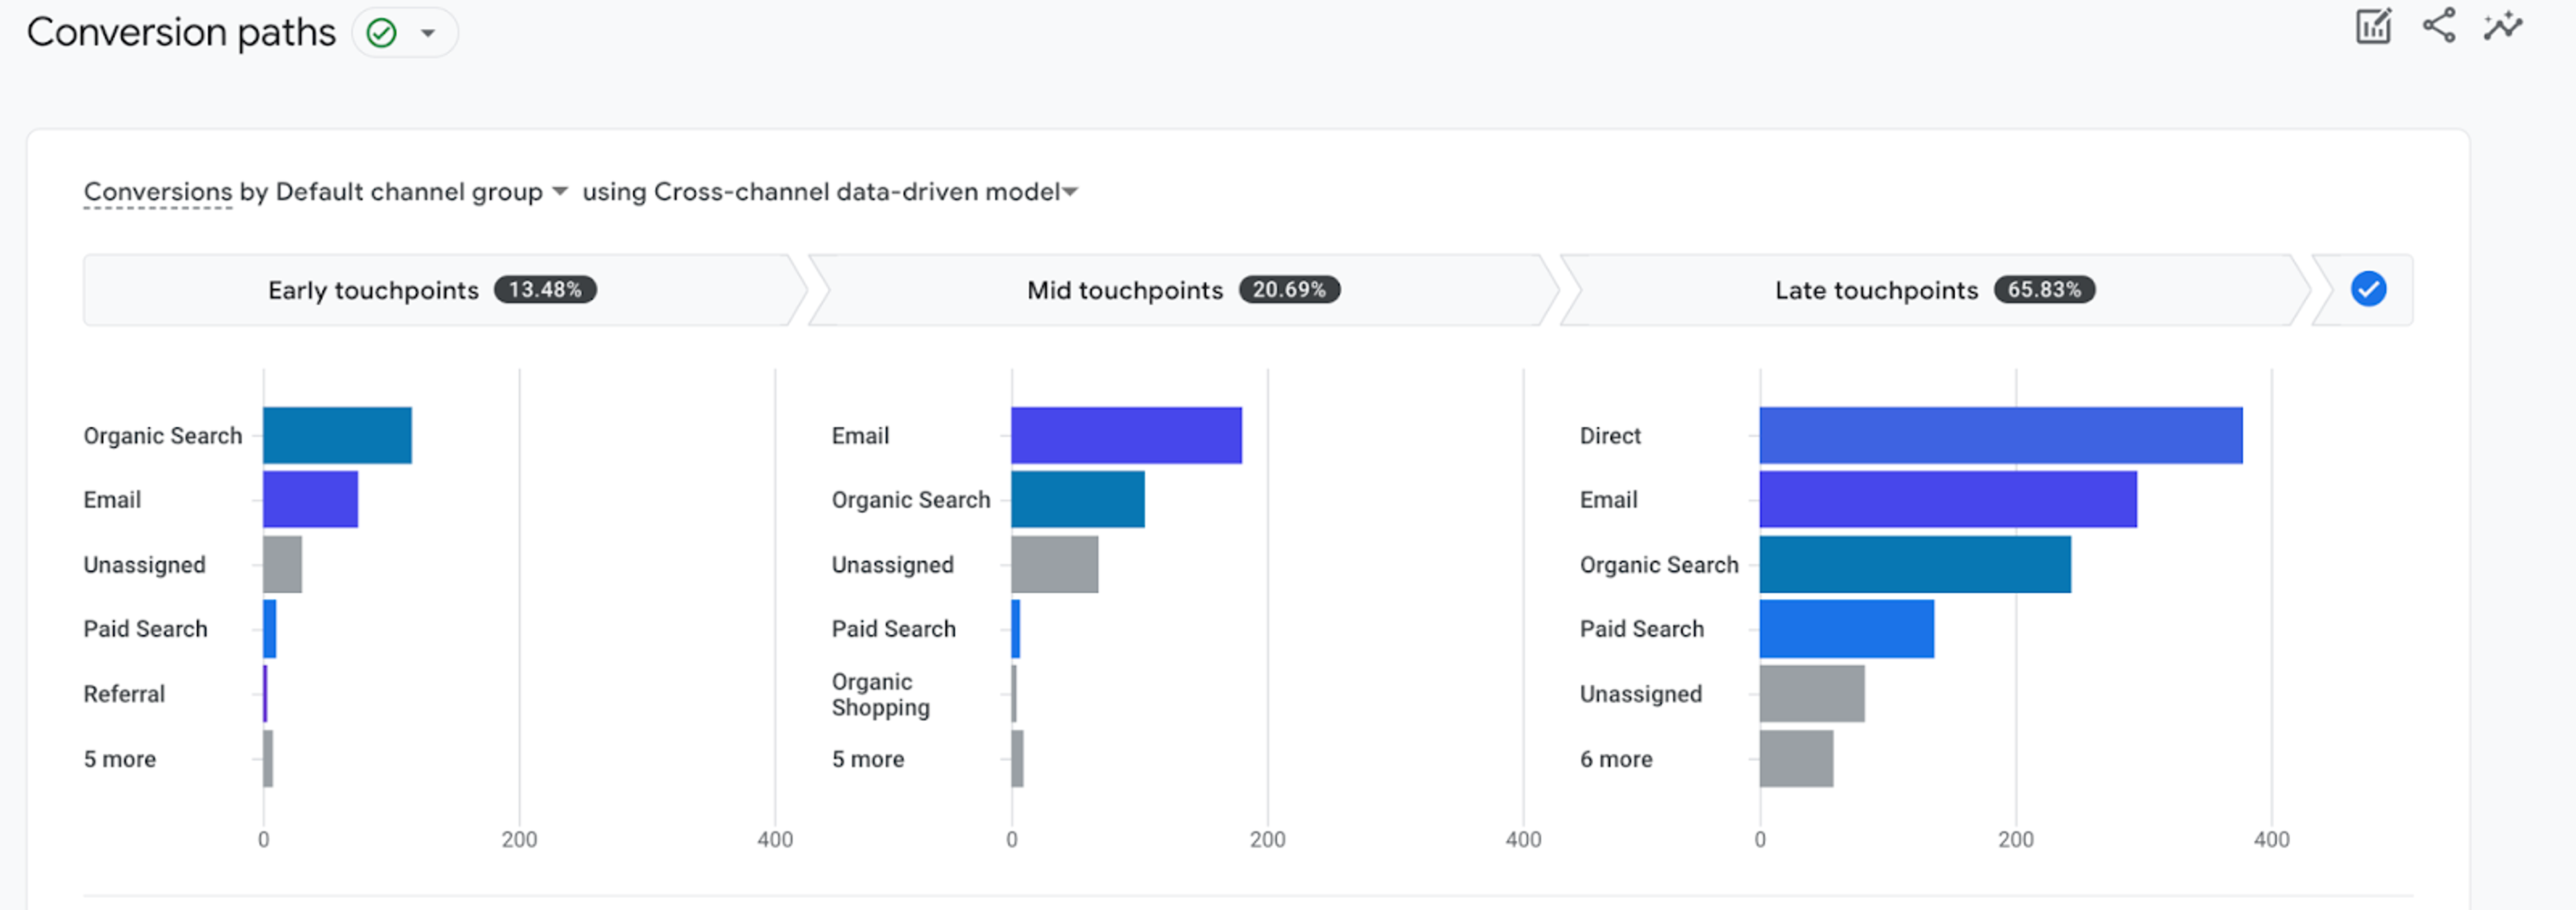
However, conversion paths are not always accurate because of the presence of direct traffic. Sometimes, this traffic may not actually be direct traffic, as we have already mentioned in Part 1. It may just be broken links or the fact that the campaign URLs have not been properly attributed. You can reduce this confounding factor by ensuring that all links are attributed appropriately.
2.5. Site search report
A Site search report helps you understand the value that you offer the market. The Site search report shows you which of your products users are asking for in your store. When you know the level of demand for your products, you can supply accordingly, price accordingly, and make more profits.
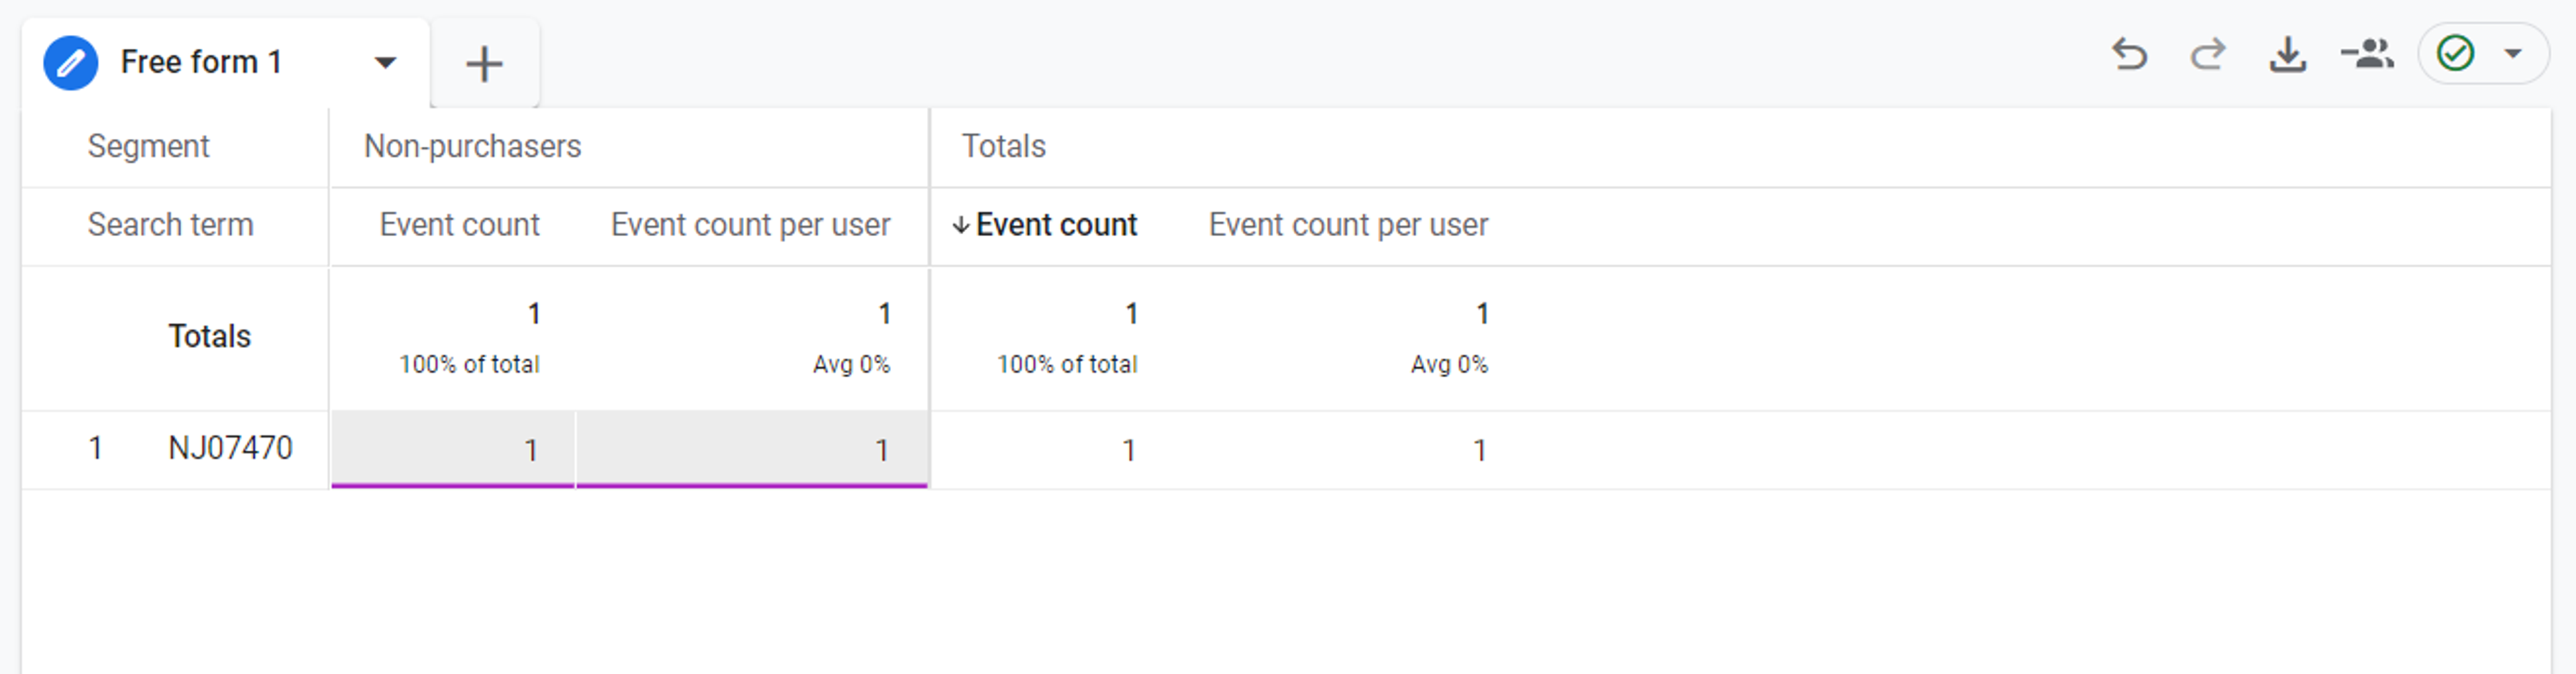
However, in order for your Site search report to be accurate, your links must be in the right format. Keep in mind that GA4 does not support queries that have dashes in them.
To control this, open the Enhanced measurement options in Admin - Data stream settings.
Then, press Show advanced settings for Site search events.
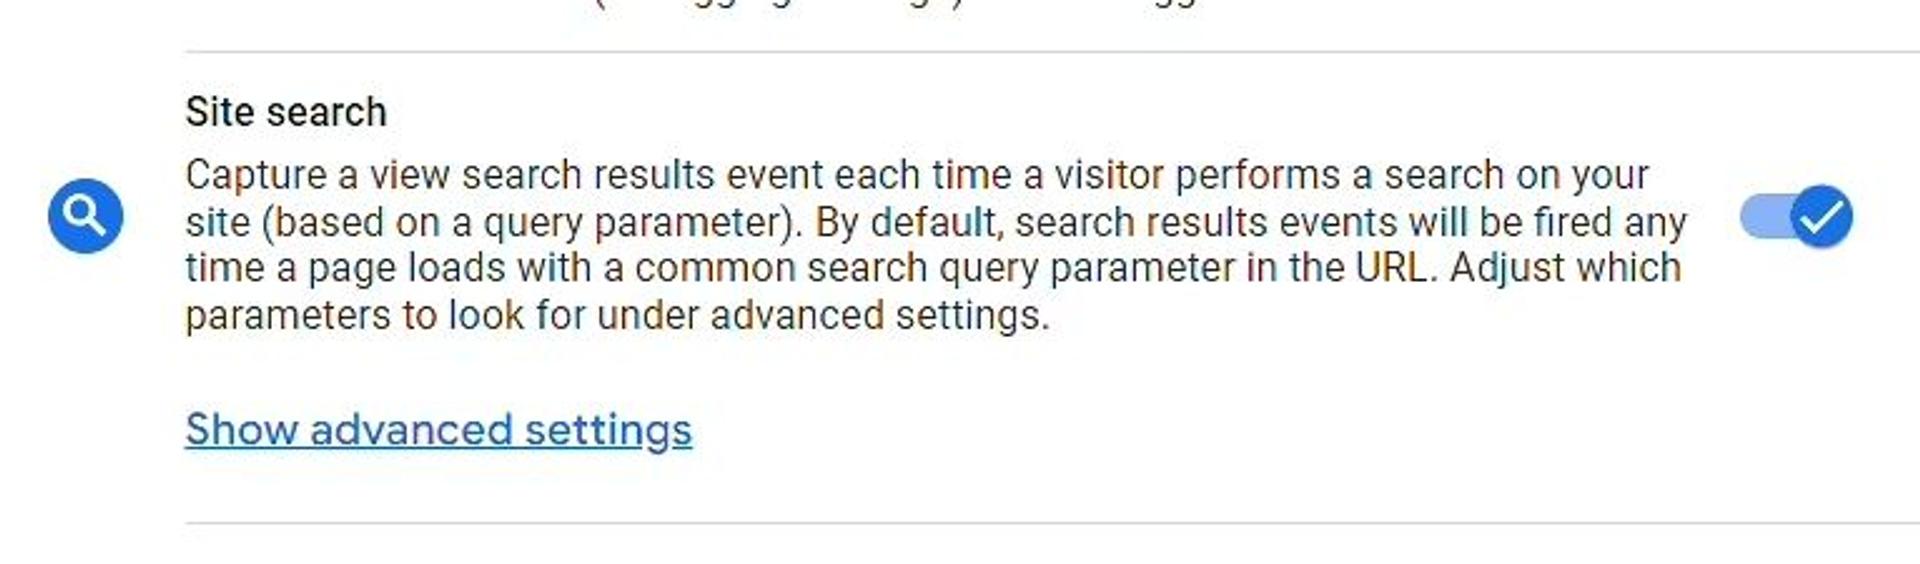
Here, you can specify URL queries from your search URL that is configured on your website.
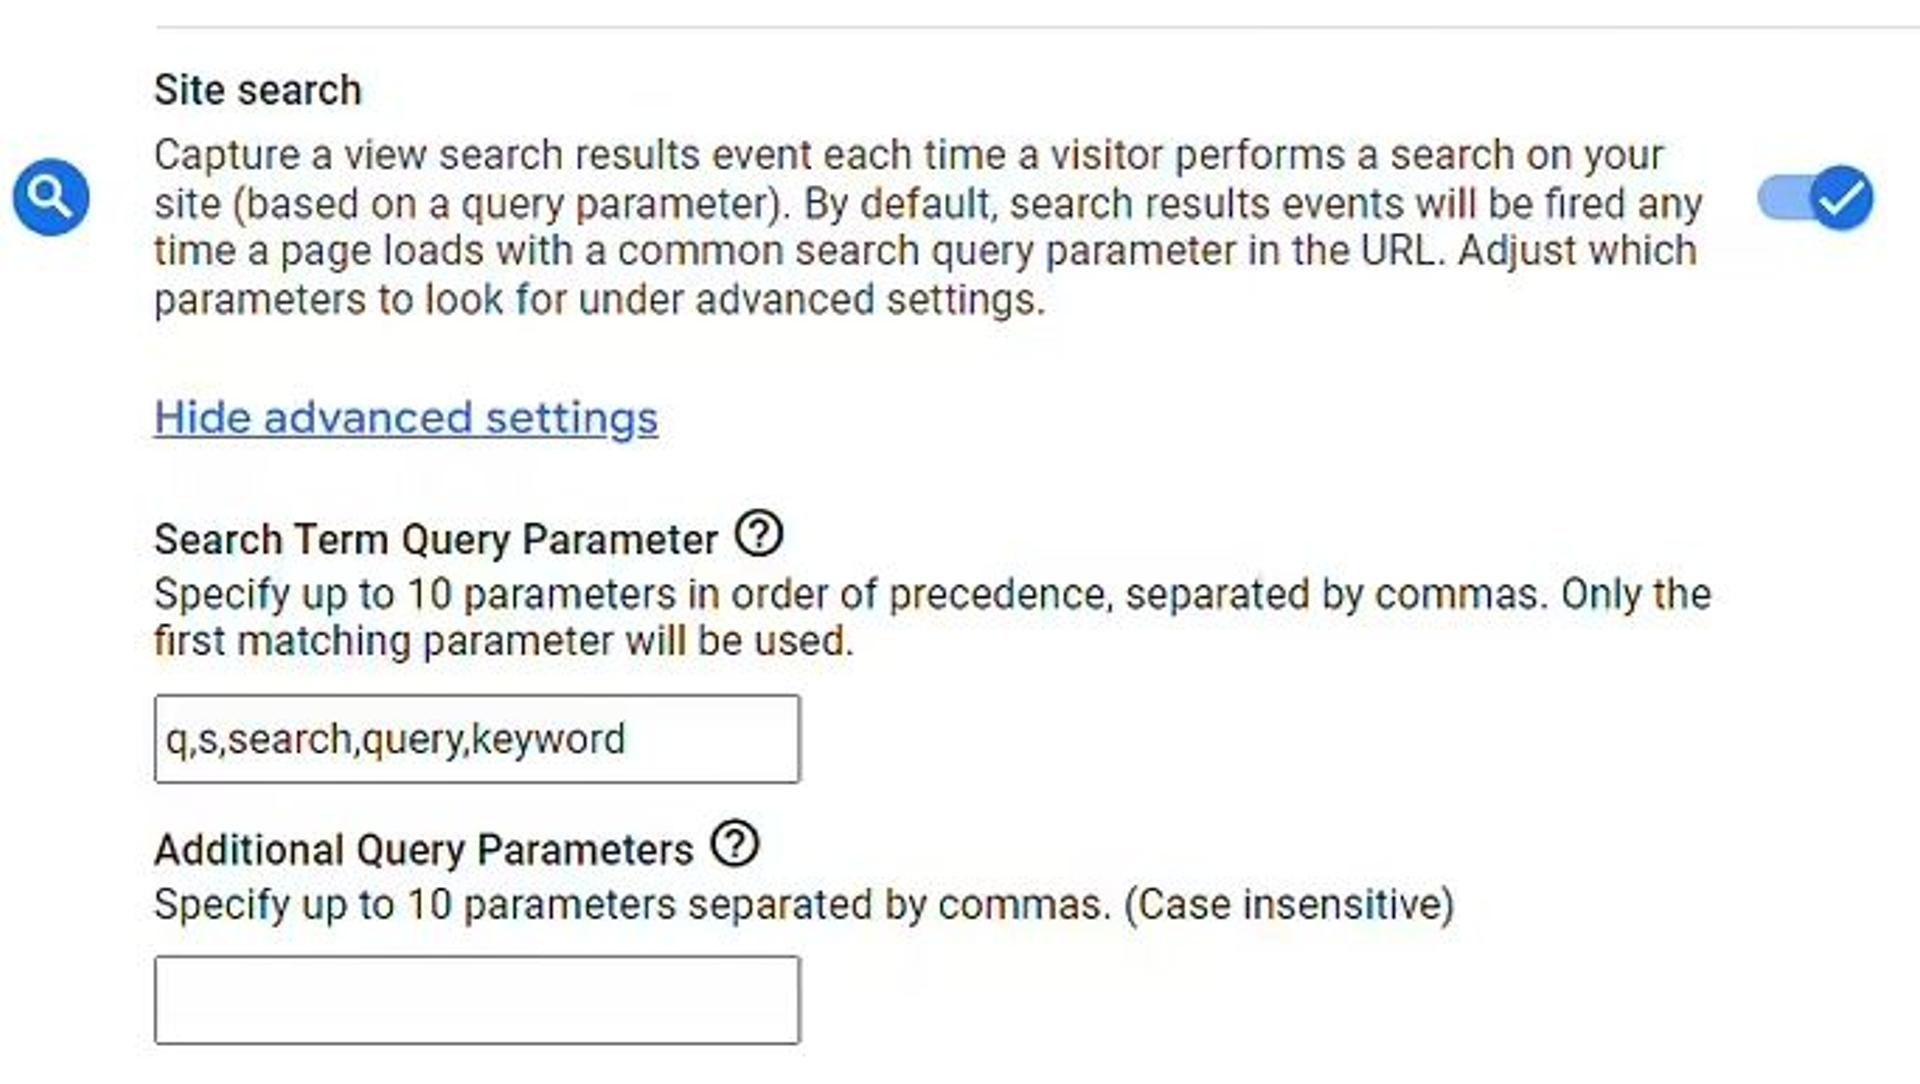
Those queries will define the Search term parameter value of your search event.
2.6. Landing pages report
In GA4, Landing pages reports are quite similar to those that were found in Universal Analytics. So if you have experience in that system, you should feel right at home here.
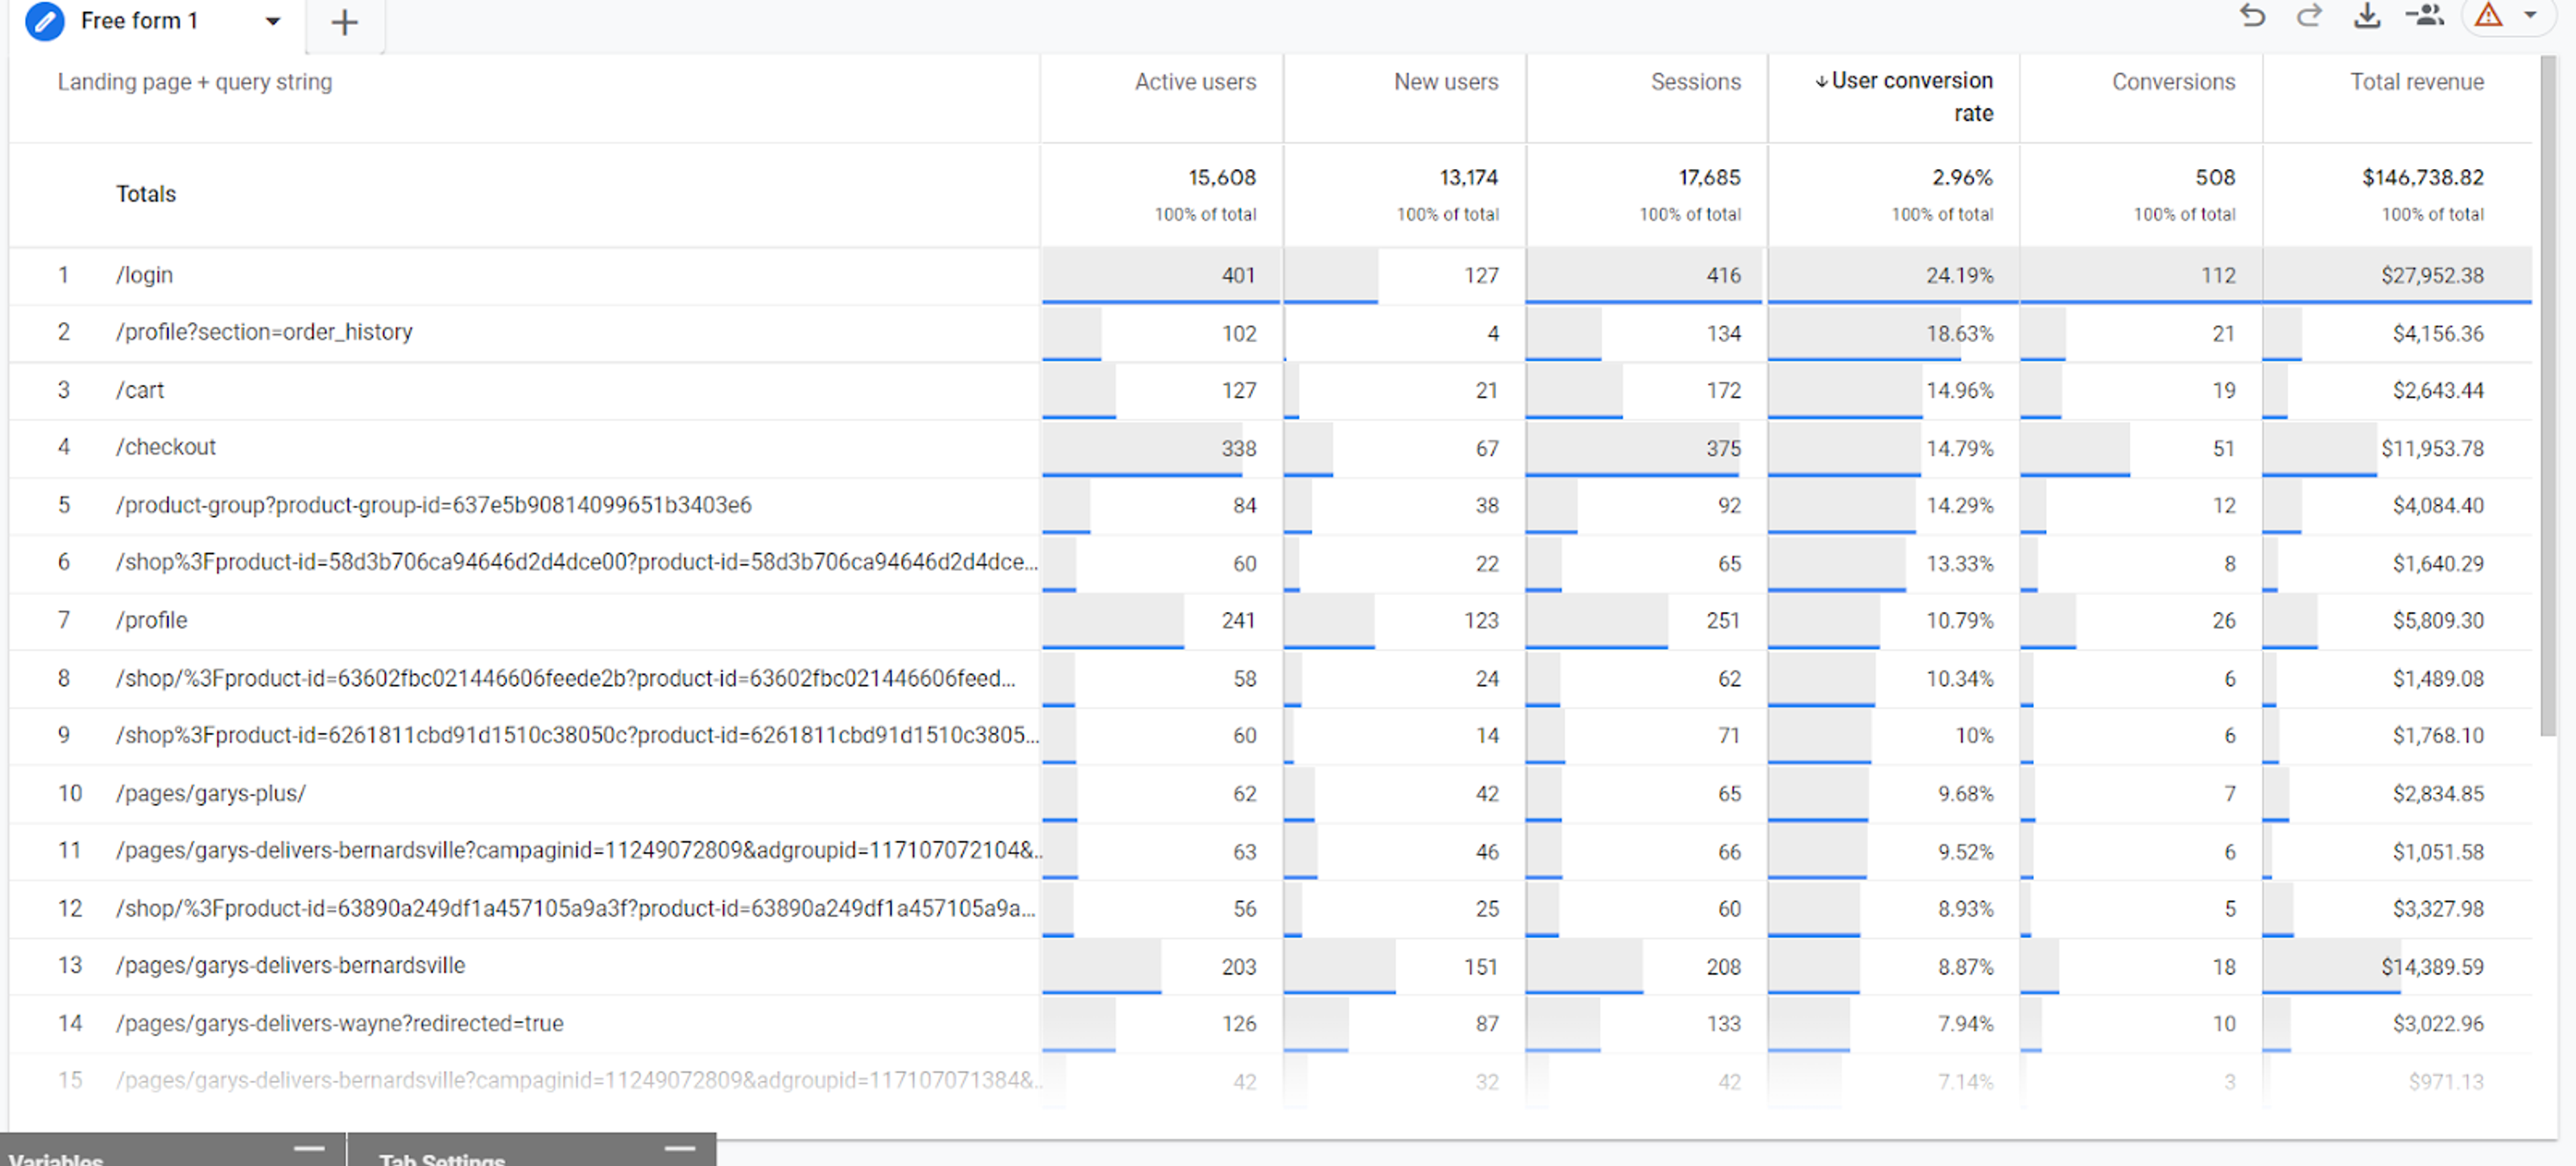
The landing page refers to the first page your users land on when they click on an external link to your products. The Landing page report evaluates all landing pages to determine which ones convert the most leads. The report tests the effectiveness of your pages using different metrics, including how many active users got to your landing page, how many new users are among them, how much time they spent on the page, how many visitors were converted, and the total revenue from that particular landing page.
It is important to evaluate landing pages since even minor errors on a few landing pages can lead to a significant loss in revenue. For instance, a typographical error that results in "Join the conversion" being shown instead of "Join the conversation" could turn away several leads.
With these reports, you can easily identify and resolve these issues before they cost you too much.
2.7. Top events tracking report
Tracking your events helps you understand which actions send most users to your page. GA4 provides you with two ways to get data on them: Standard reports and Exploration reports.
Standard reports are automatically generated by Google. They provide a simple way to get a general overview of the situation. However, they can not be customized to provide specific details that may be important to you.
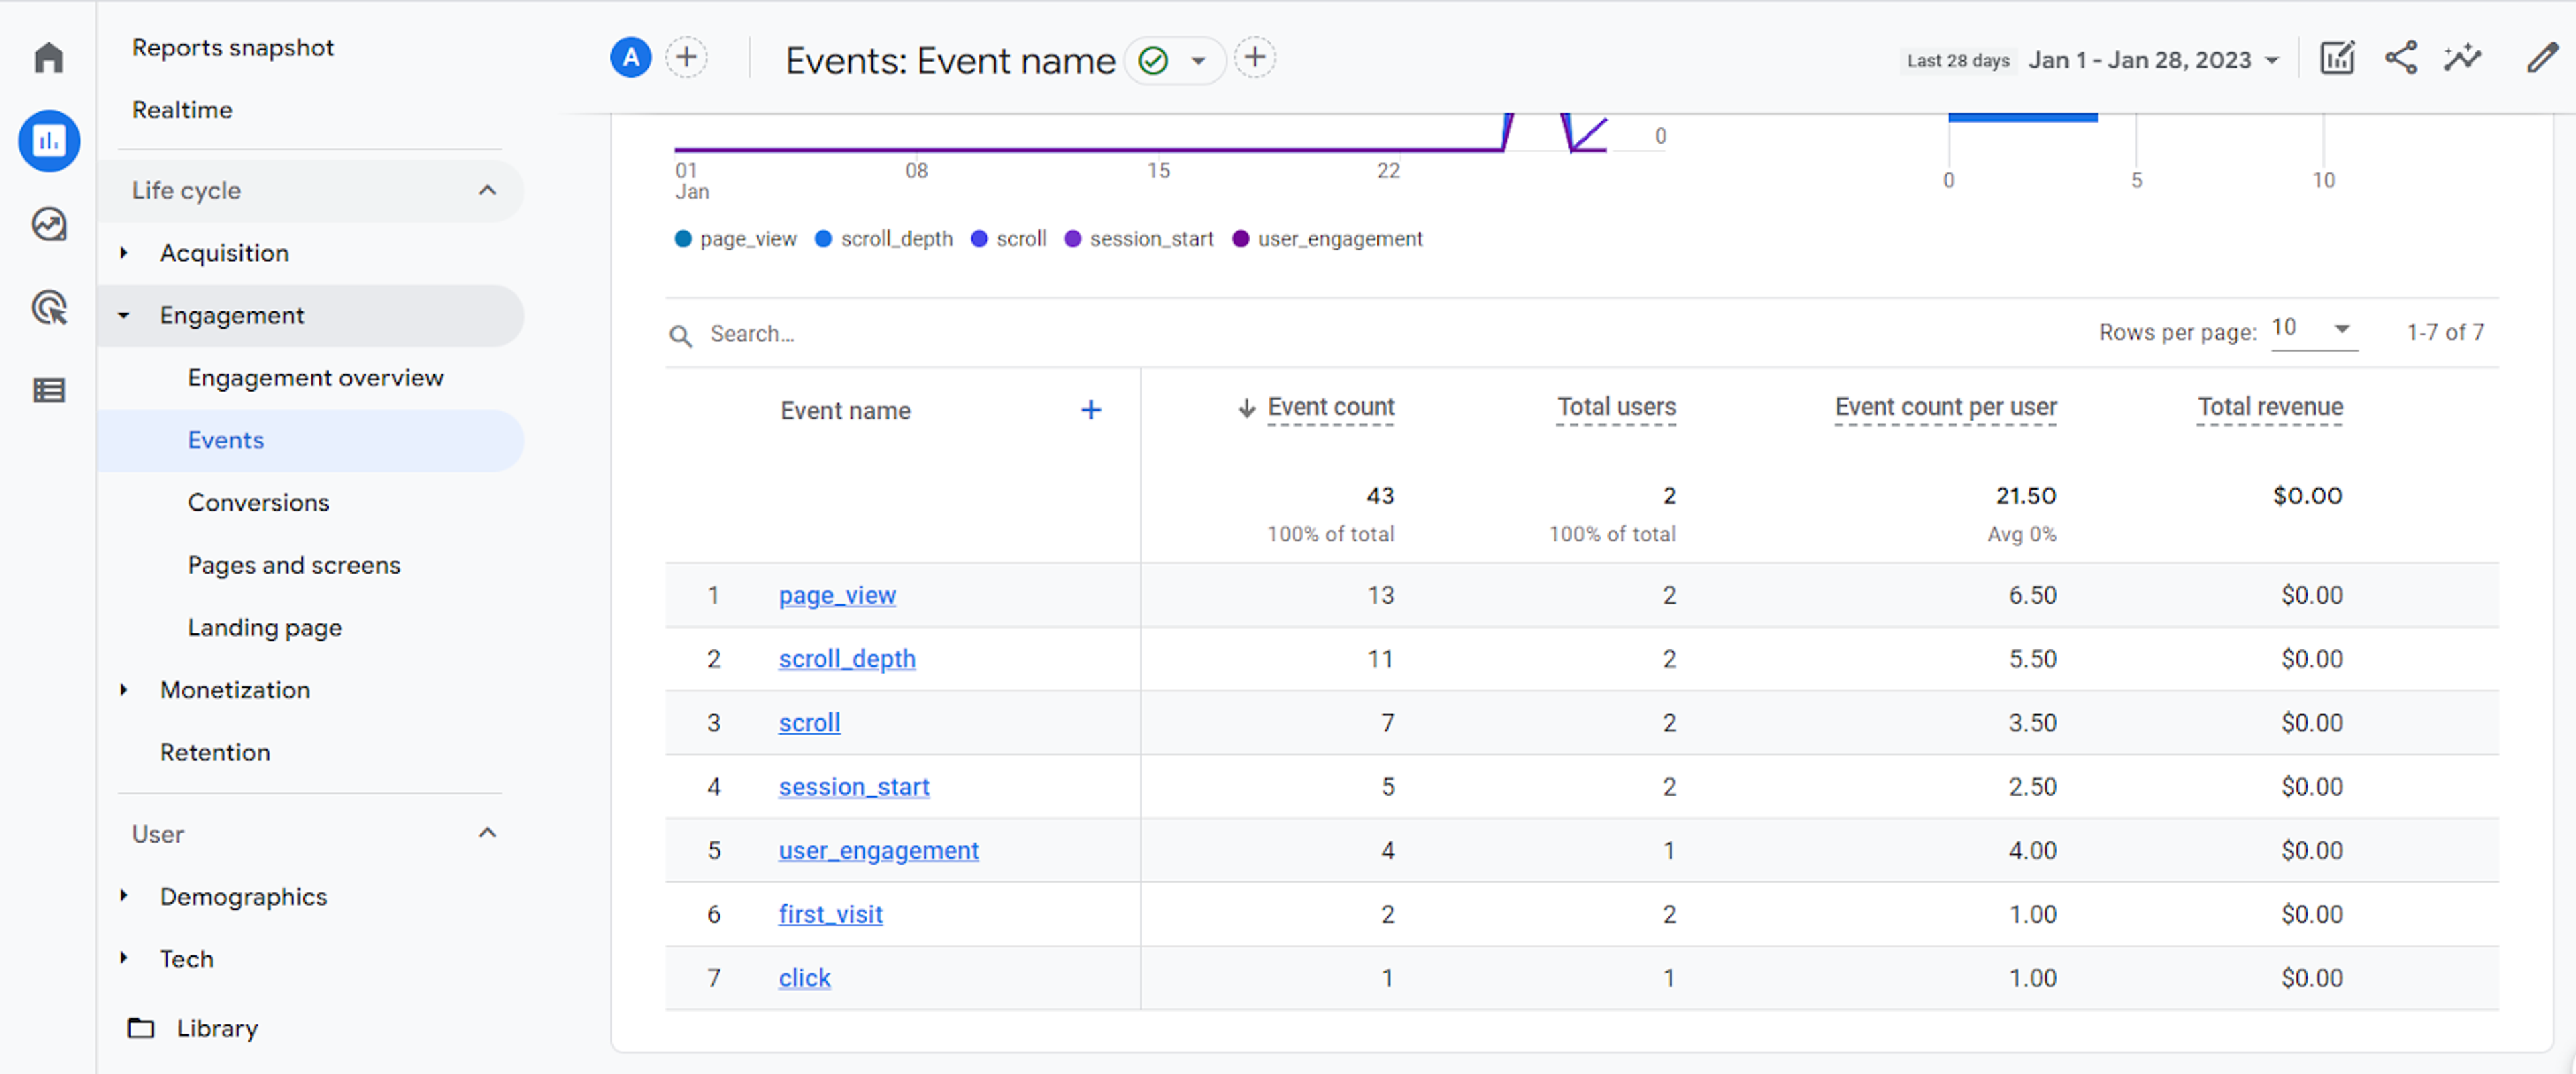
For that, we have Exploration reports. They can be created in the Explore section.
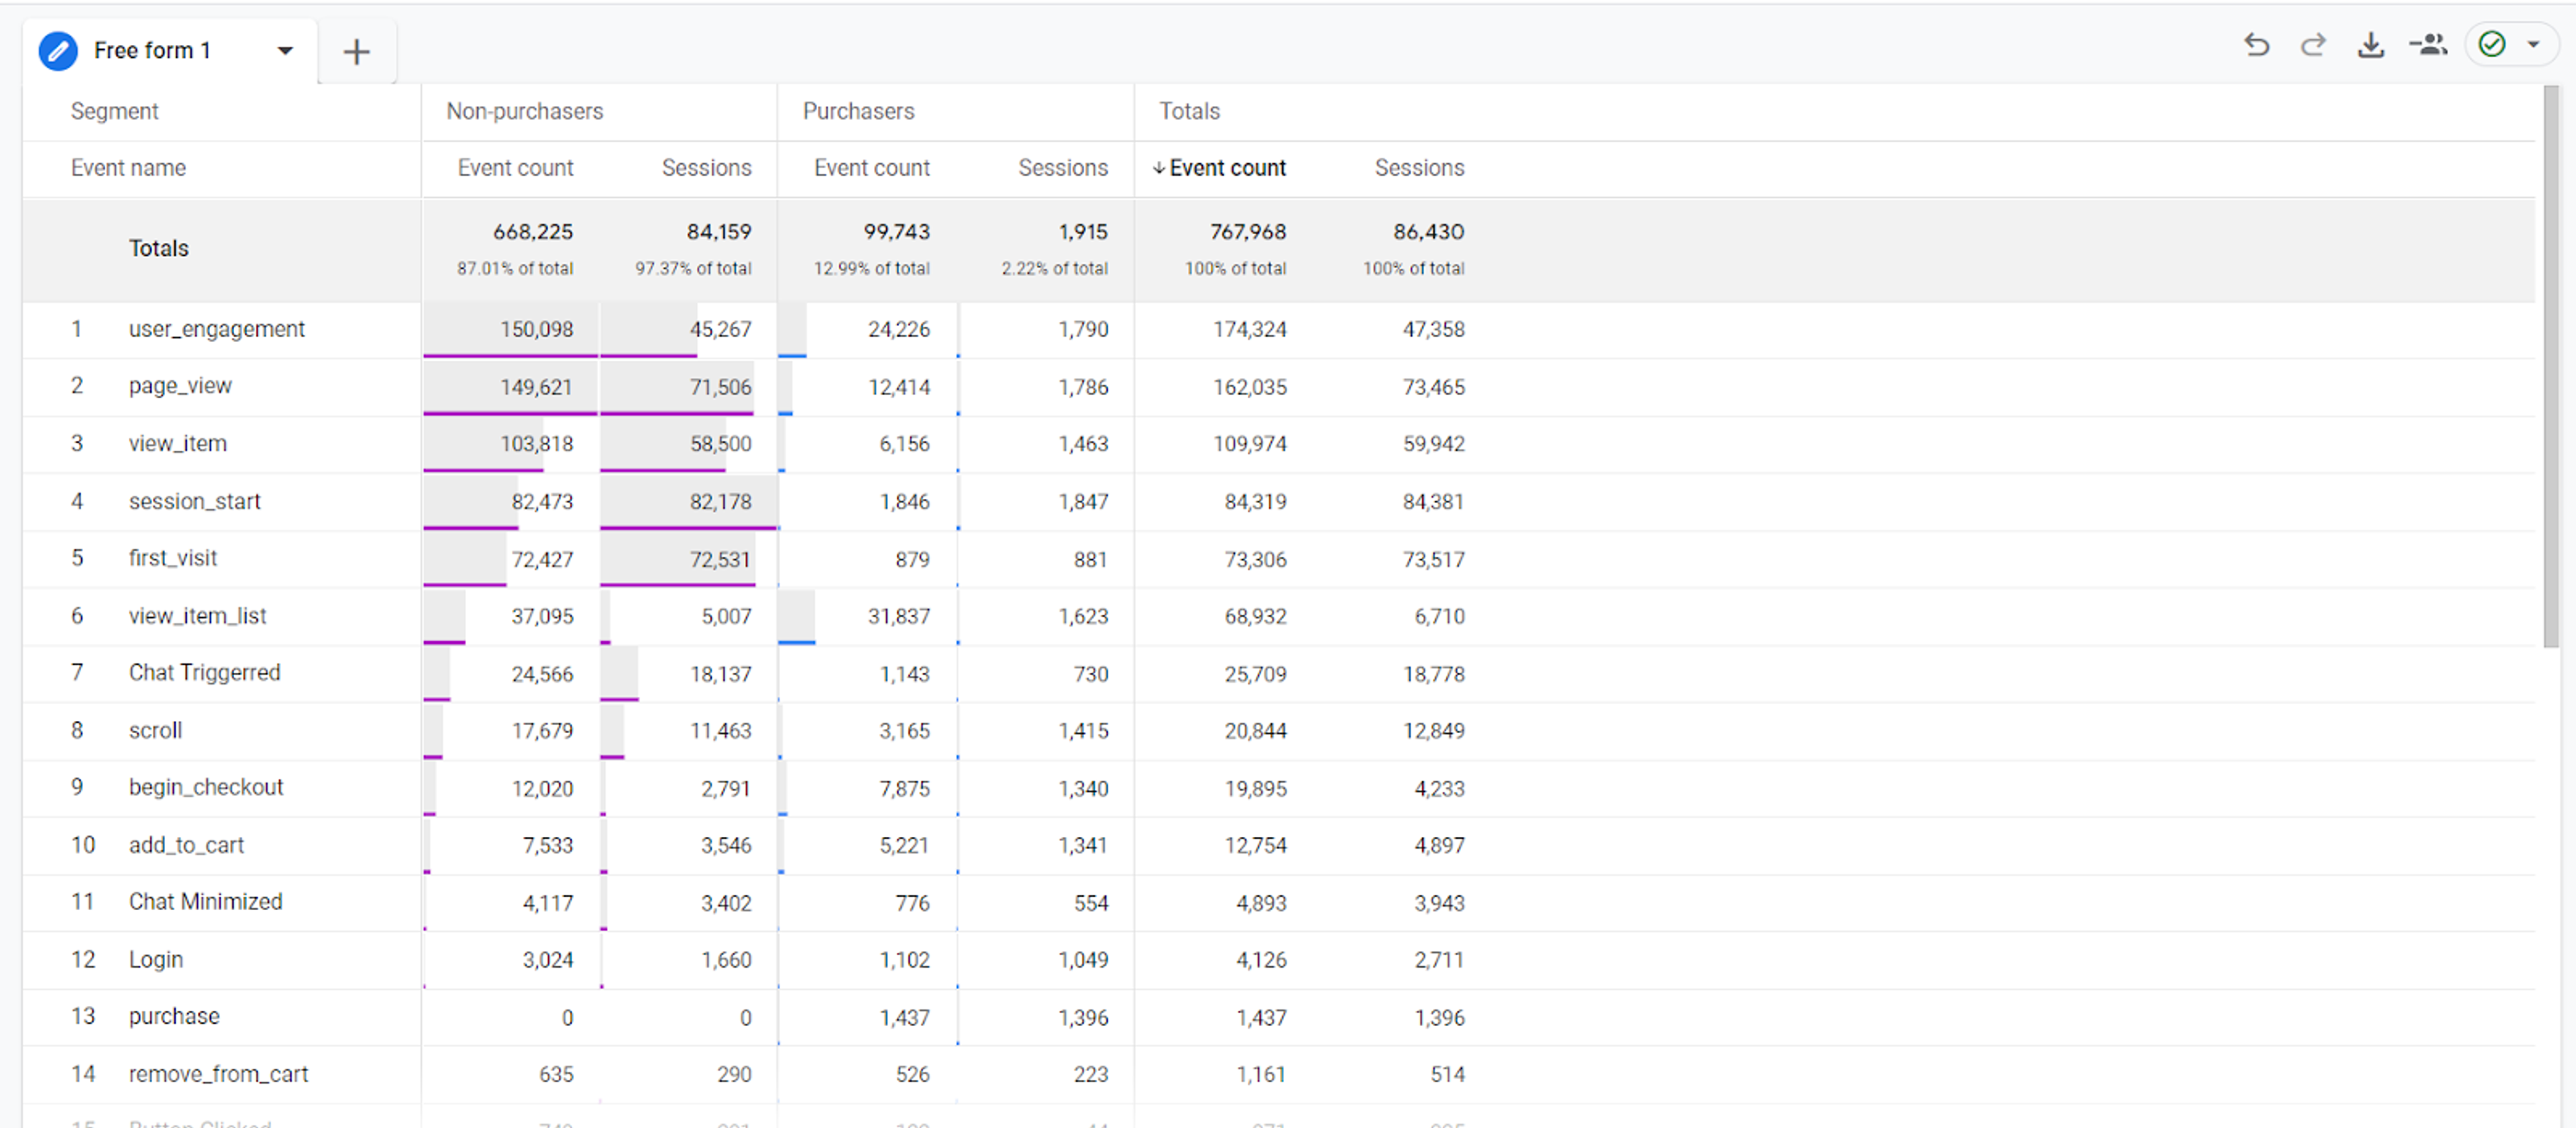
These reports allow you to customize the events, audience segments, and metrics that you want to pay attention to.
To measure your conversion rate more accurately, events tracking in the GA4 property should be configured properly. Through this report, you can investigate all the events you are tracking. This information allows you to detect issues by analyzing the number of events that occur.
2.8. Demographic reports
2.8.1. Location report by region
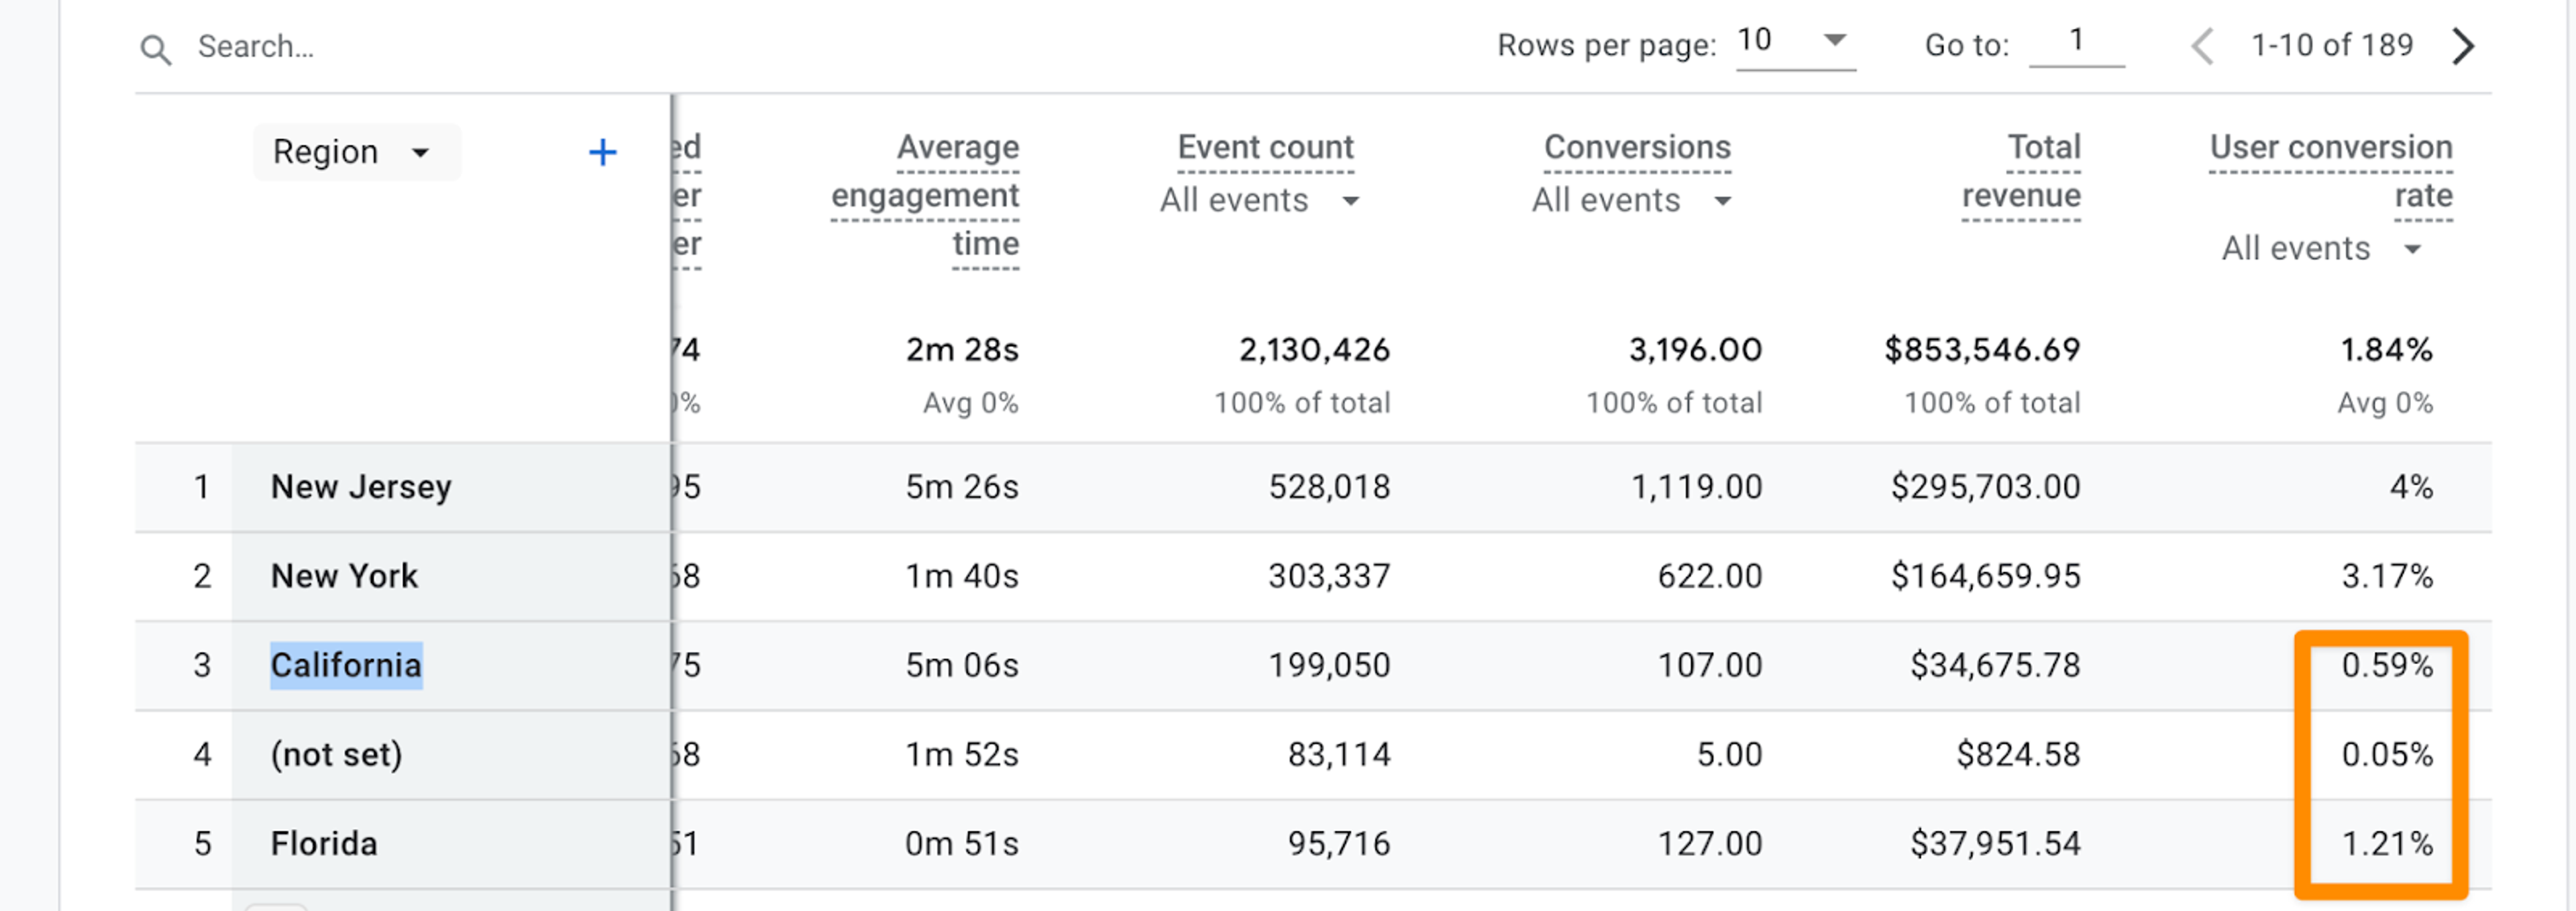
GA4 can provide information on the location of your visitors. Apart from showing the conversion rates, this report contains the continent, subcontinent, country, region, city, and metropolitan area of each user. This information allows you to know exactly where your audience is. With this information, you can adjust your advertising and content to better target your audience. It also helps you allocate your budget according to your targets for maintenance, expansion, or optimization for each region.
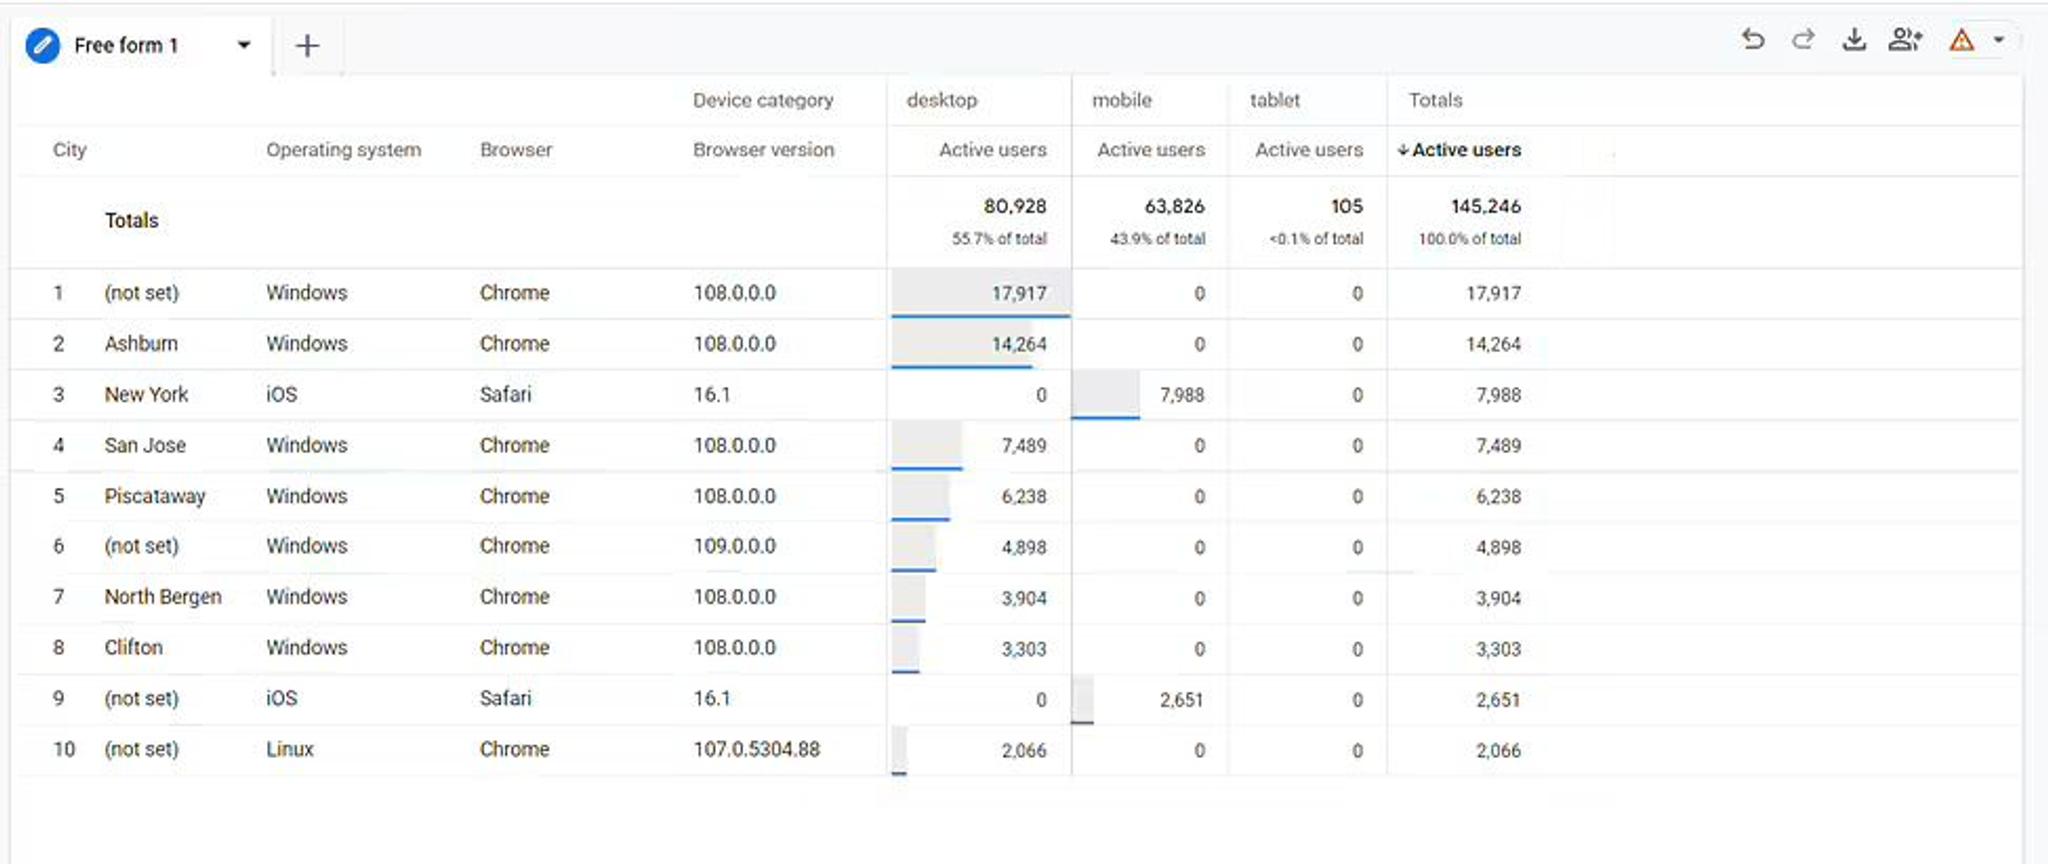
2.8.2 Browser report
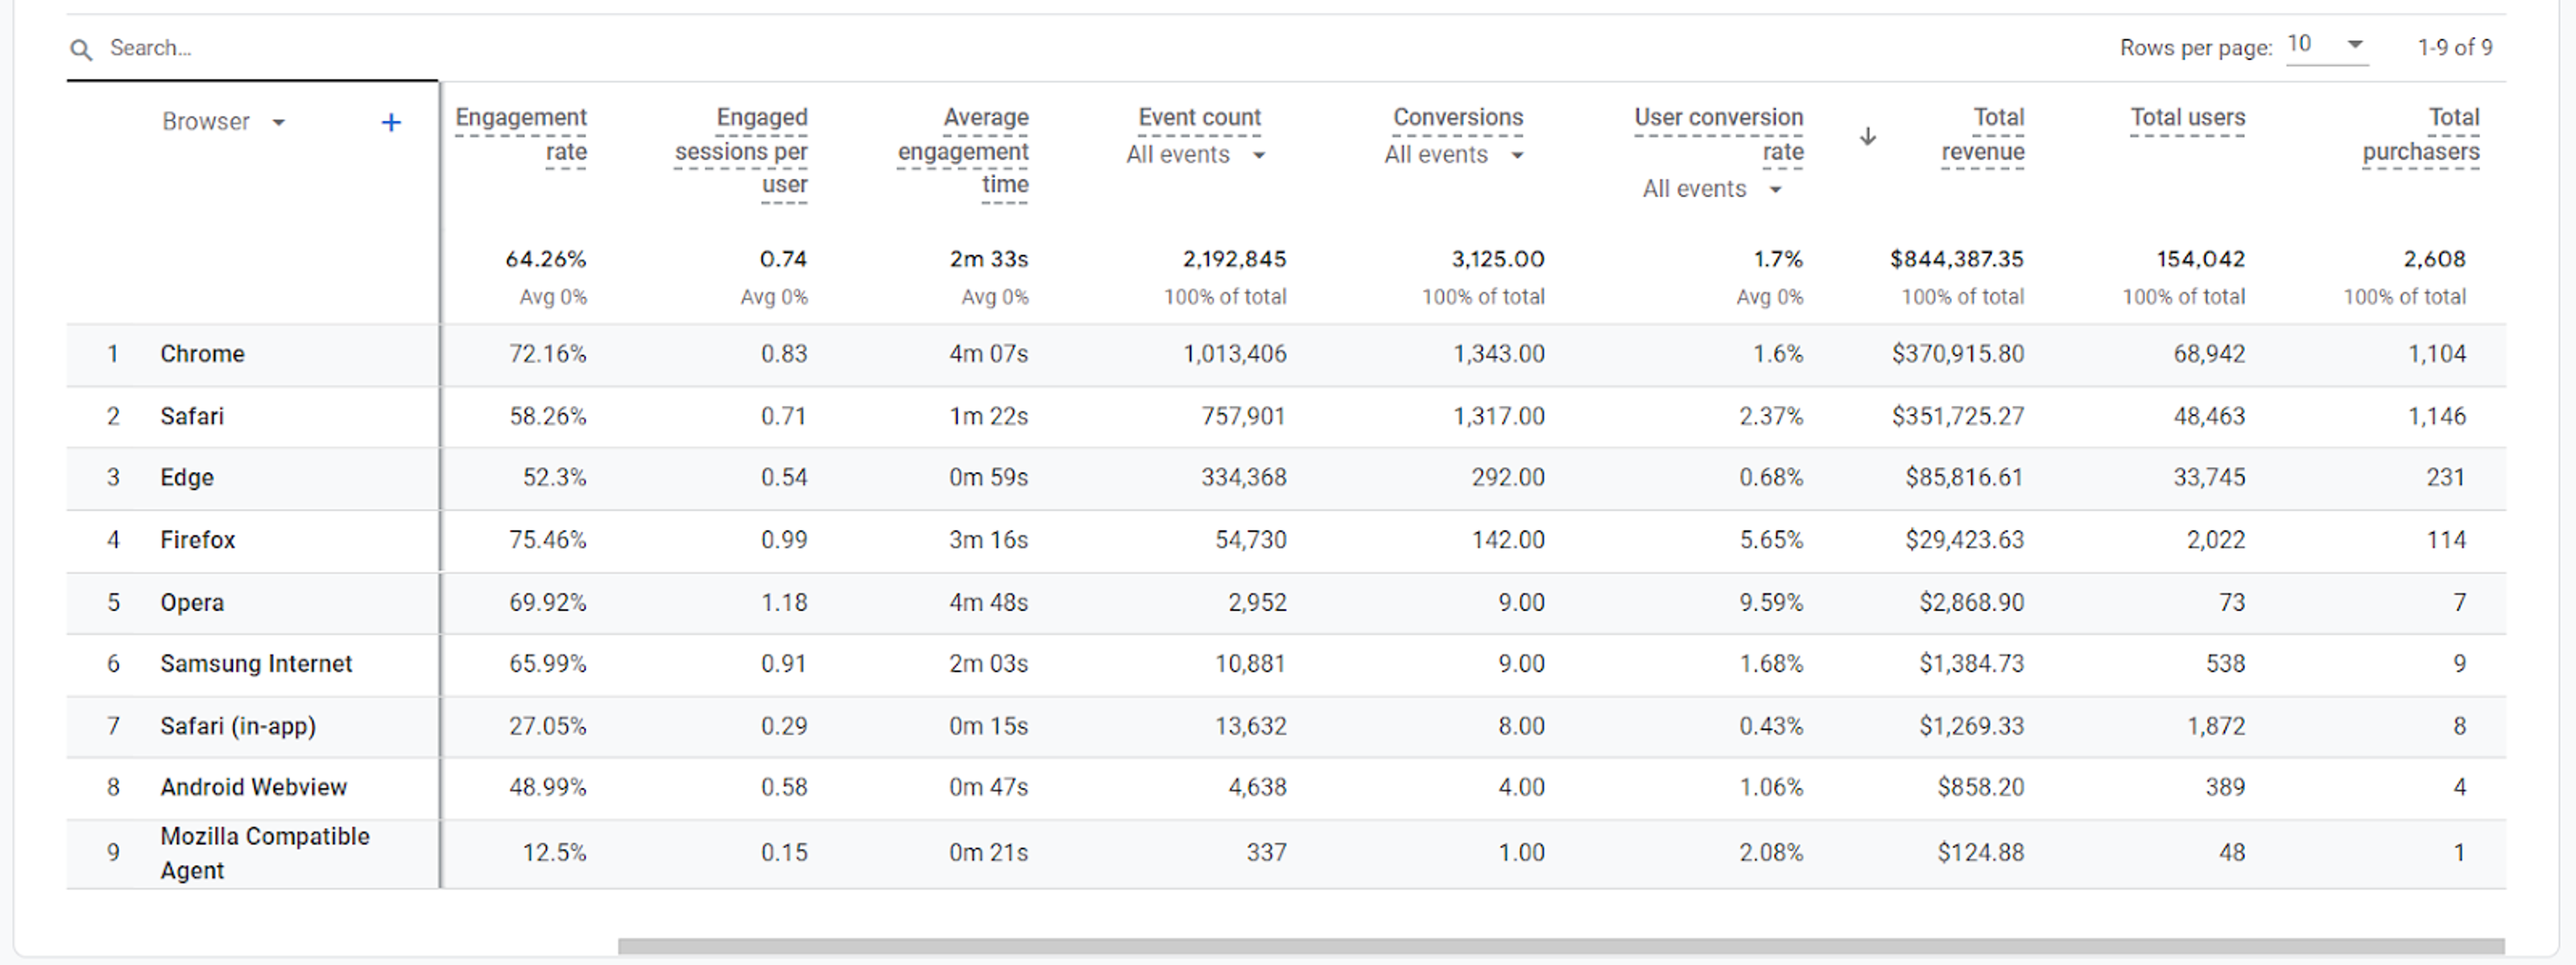
This report shows you a breakdown of conversions based on the device, operating system, or browser they were carried out on. For the most part, this report tells you how many of your clients are using a given browser. In the case that you plan to use any browser category information, the report comes in handy.
Afterword
I hope that this guide has been informative. While there is certainly more to GA4 than I have presented here, the knowledge you now have should be enough to make a good start in interpreting data from GA4.
Remember that Google Analytics is an incredibly complex and, sometimes, convoluted tool. It is easy to feel overwhelmed or even intimidated by all the different features, settings, and integration options it gives you. I admit that I was intimidated the first time I had to work with it almost ten years ago.
Do not be discouraged. Every challenge is an opportunity to grow. My friends and colleagues at UAWC know that as well as I do; growth is something we are proud to specialize in. And we are always ready to share our expertise with those who need it.
Schedule a discovery call now to take a big step toward reduced worries and increased incomes.
